


Spot gold is approaching a key support zone after seeing sharp downswings since last week.
How low can gold go before the bulls step back in?
Gold (XAU/USD): 4-hour
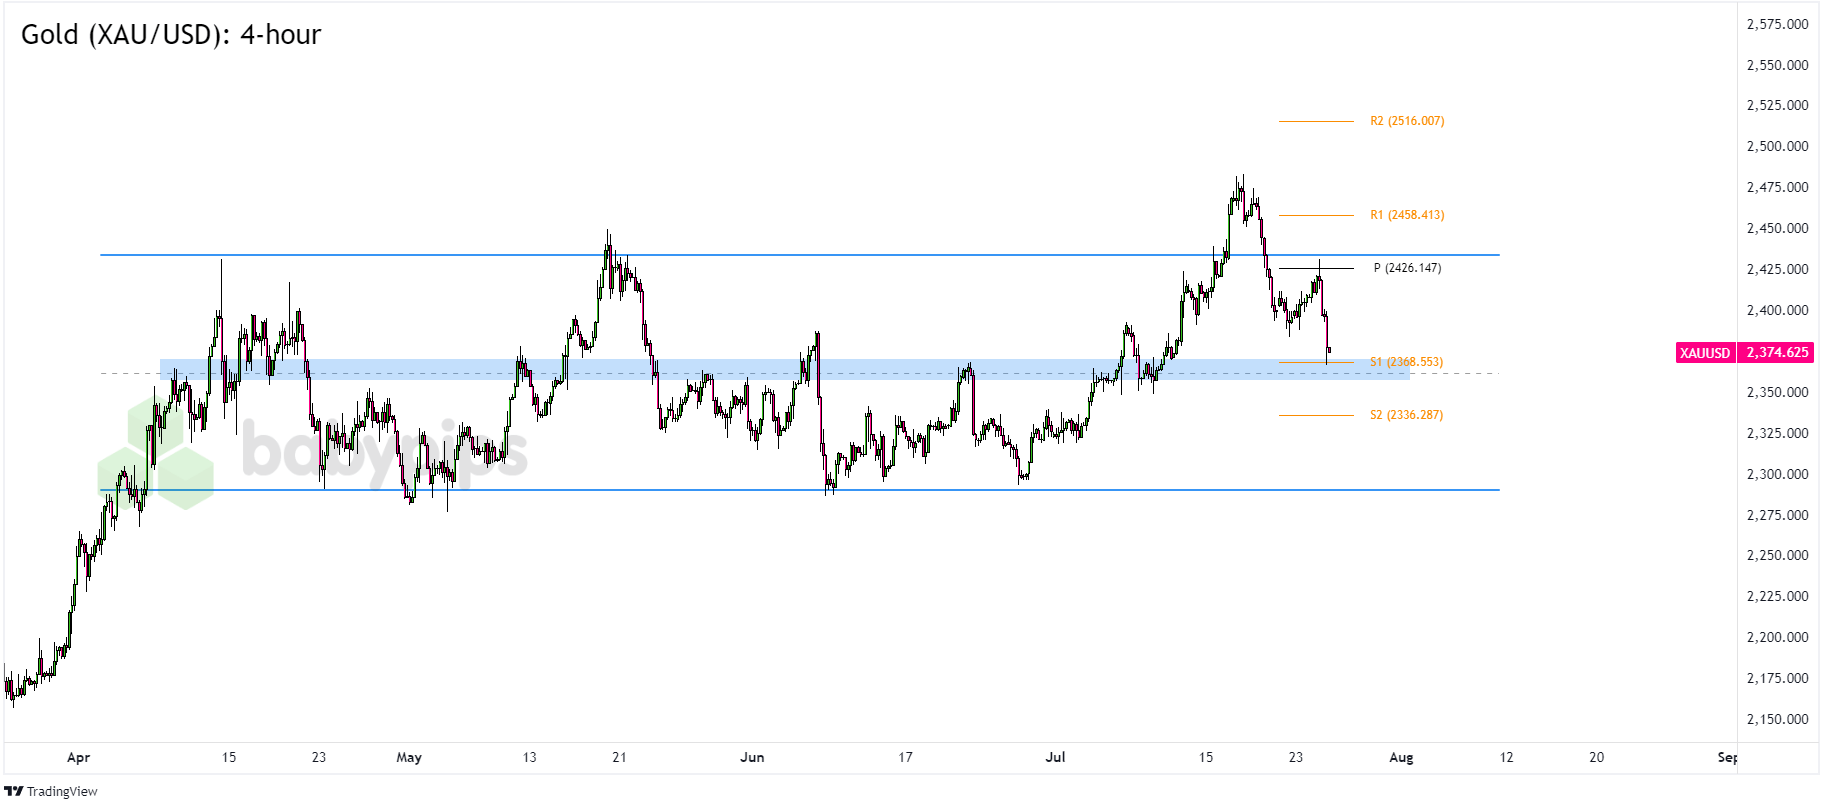
Gold (XAU/USD) 4-hour Chart by TradingView
Increased U.S. dollar demand and concerns over China’s economic growth have contributed to lower gold prices in the past few days. XAU/USD turned from its $2,480 all-time highs down to its current levels near $2,370.
Remember that directional biases and volatility conditions in market price are typically driven by fundamentals. If you haven’t yet done your fundie homework on gold and the U.S. dollar, then it’s time to check out the economic calendar and stay updated on daily fundamental news!
The pair is seeing fresh bearish pressure as traders stay on the sidelines ahead of top-tier U.S. data releases.
How low can XAU/USD go before it sees sustained demand again?
We’re eyeing the $2,360 zone that lines up with the S1 ($2,369) Pivot Point line as well as the middle of a technical range in the 4-hour chart.
If the pair extends its sharp downswings and busts through the mid-range support, then more bears may come in and drag XAU/USD to the S2 ($2,336) line if not the $2,300 range support zone.
A bounce from the mid-range levels, on the other hand, exposes XAU/USD to a move back to its previous highs. Look out for bullish candlesticks and then bullish momentum above the potential support zone, which could take gold to the Pivot Point line ($2,426) or its previous $2,447 highs.