


As mentioned in today’s Daily Broad Market Recap, the U.S. SEC has approved six ether (ETH) ETFs, set to start trading as early as Tuesday.
It’s no surprise that bitcoin faced some bearish pressure as traders considered the possibility of bitcoin HODLers shifting some of their funds to ETH-related assets.
BTC/USD, which turned lower from its $68,400 monthly highs, is now hovering around the $66,000 psychological level.
More importantly, bitcoin’s current levels align with the 4-hour chart’s Pivot Point and trend line support, as well as an inflection point from last week.
Are we looking at a trend pullback opportunity here?
Bitcoin (BTC/USD): 4-hour
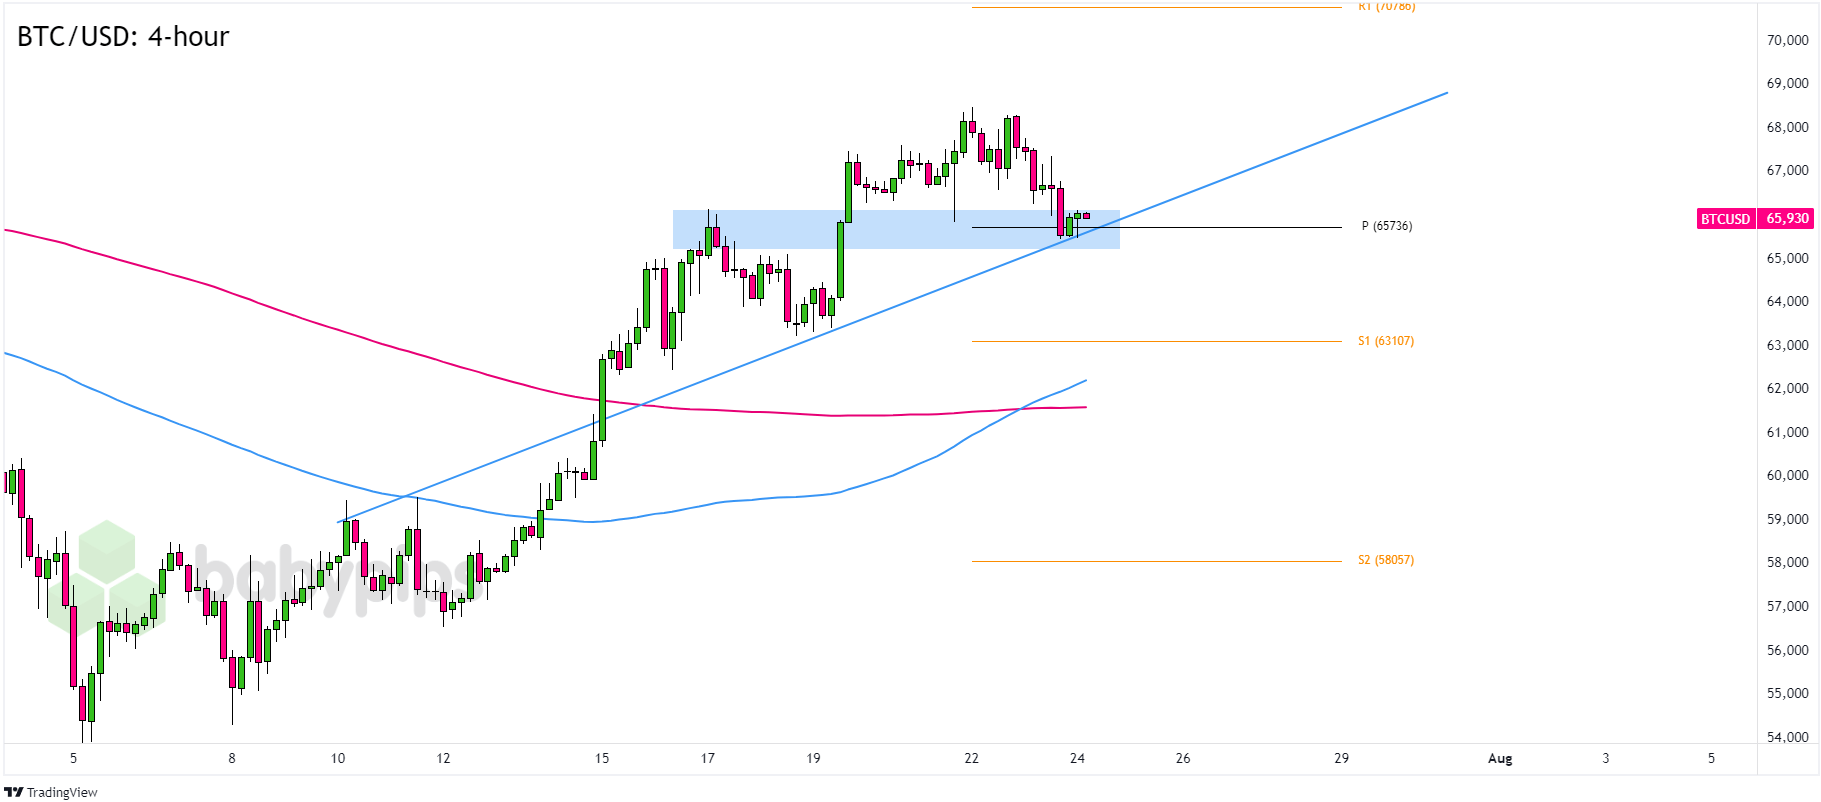
Bitcoin (BTC/USD) 4-hour Chart by TradingView
Increased attention on ETH ETFs can help push bitcoin higher since many newbie traders use the OG crypto as a “fiat on-ramp” before buying other crypto assets. Plus, the U.S. dollar’s struggle against the Japanese yen could create bearish pressure on the dollar and favor major counterparts like crypto.
BTC/USD may find support at its current levels, especially if traders act on the 100 SMA crossing above the 200 SMA and pointing to trend continuation.
Bullish candlesticks and consistent trading above the Pivot Point and trend line support could push BTC/USD back up to its $68,400 highs or even the big $70,000 mark.
But if BTC/USD continues its weekly downswing and trades consistently below the support levels we’ve marked, the pair could drop back down to the $64,000 or $63,500 previous inflection points.