


The OG crypto’s upswing may be running out of steam around key technical resistance levels!
Think BTC/USD is due for a bearish turn?
We’re taking our cues from the daily chart:
Bitcoin (BTC/USD): Daily
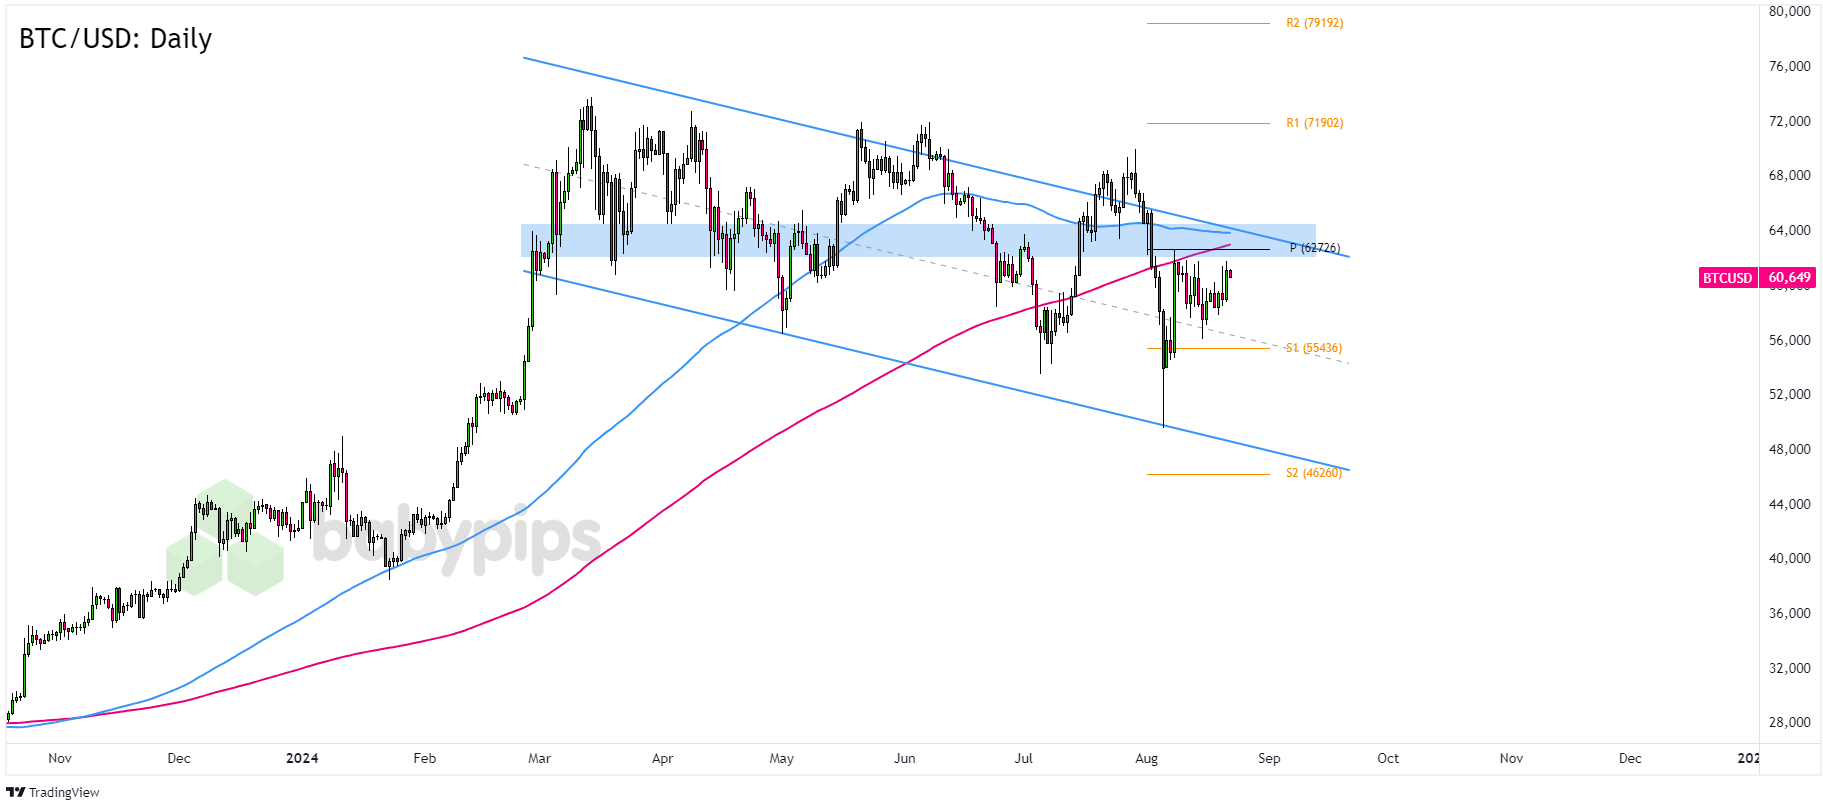
Bitcoin (BTC/USD) Daily Chart by TradingView
August has been a pretty good month for bitcoin so far, as BTC/USD jumped from the $50,000 mark to trade closer to the $60,000 levels.
Of course, it may have helped BTC/USD that an anti-dollar sentiment took over the markets in anticipation of a Fed rate cut in September.
Remember that directional biases and volatility conditions in market price are typically driven by fundamentals. If you haven’t yet done your homework on bitcoin and the U.S. dollar, then it’s time to check out the economic calendar and stay updated on daily fundamental news!How high can BTC/USD fly with its momentum?
Eh. Probably not much farther.
For one thing, increasing U.S. stock prices may weigh on bitcoin demand and limit BTC/USD’s gains.
BTC/USD is also having trouble busting through the $60,000 – $62,000 levels, which is right around where the daily chart’s 100 and 200 SMAs and Pivot Point levels are. More importantly, bitcoin’s current levels are not far from a descending channel resistance that’s been around since March.
Watch for bearish candlesticks and sustained trading below $62,000, which could draw in sellers and drag BTC/USD to the $57,000 previous support or the mid-channel area near the S1 ($55,436) Pivot Point line.
But if BTC/USD manages to stay above $60,000 and regain fresh bullish momentum, then the pair could retest the $64,000 resistance. Bitcoin bulls could make a play for the $68,000 previous highs and inspire a bullish breakout that may take BTC/USD to the $70,000 mark.
What do you think? Can BTC/USD sustain its bullish momentum this month?