


Are U.S. equities in for a major selloff soon?
Better keep tabs on this reversal pattern forming on the 4-hour chart of the S&P 500 index.
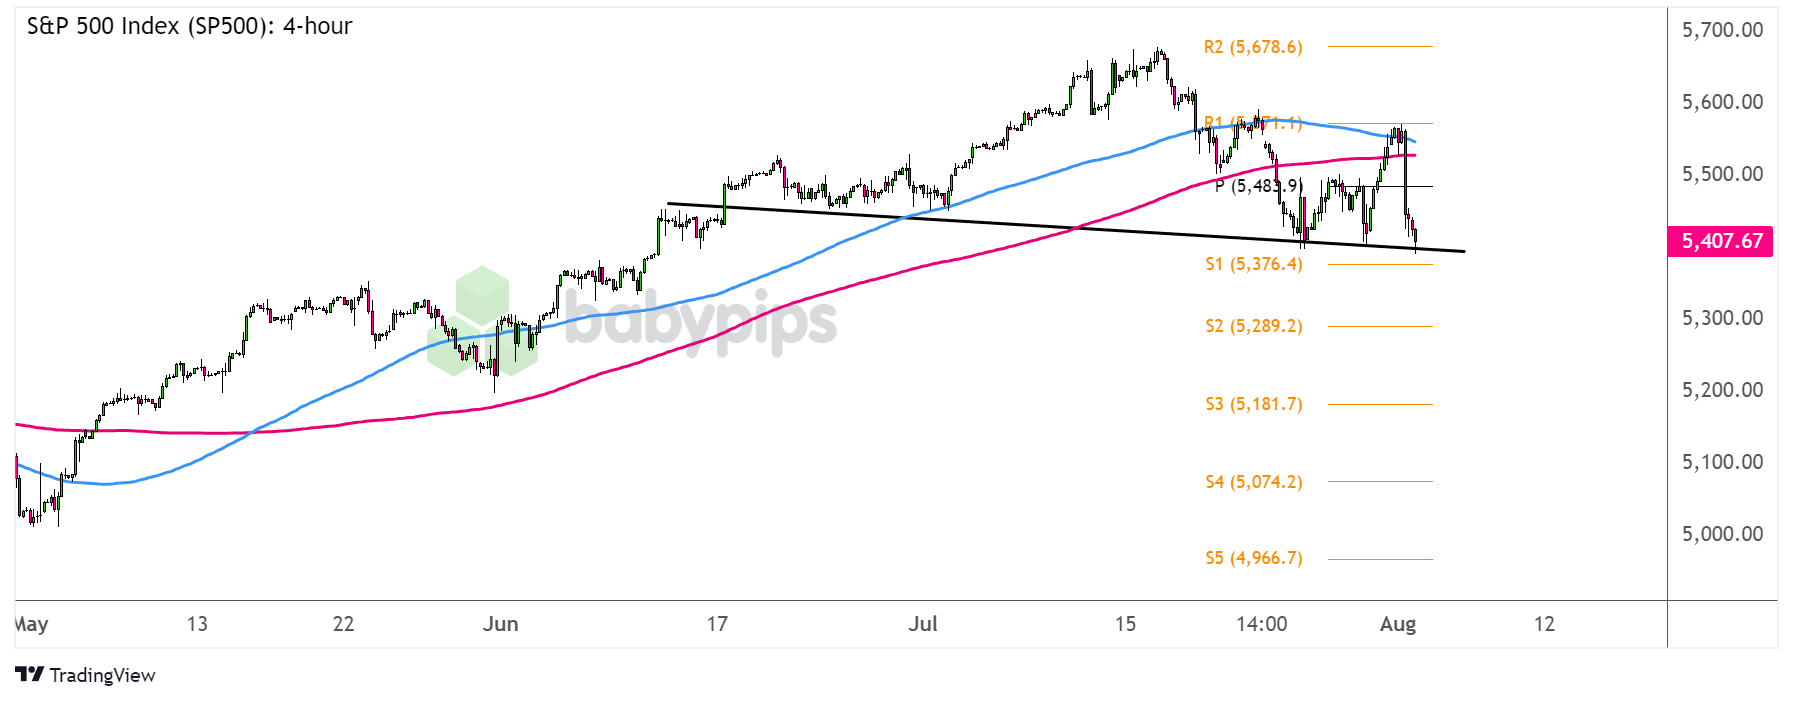
S&P 500 Index (SP500): 4-hour
S&P 500 Index (SP500) 4-hour Chart by TradingView
U.S. stock markets still seem to be feeling the brunt of the tech sector selloff, as investors continue to doubt that the AI-led rallies could be sustained.
It doesn’t help that the latest round of earnings reports has been disappointing, with bigshots like Amazon missing revenue expectations and Intel announcing workforce cuts.
With that, the S&P 500 index suffered a sharp selloff in the latest trading session, taking it down to the neckline of its head and shoulders pattern on the 4-hour chart.
Can it break lower soon?
Remember that directional biases and volatility conditions in market price are typically driven by fundamentals. If you haven’t yet done your homework on U.S. equities, then it’s time to check out the economic calendar and stay updated on daily fundamental news!Sustained selling pressure could spur a breakdown and a downtrend that’s the same height as the chart pattern, potentially taking the stock index down to the next area of interest at S3 (5,181.70) or lower.
The 100 SMA is above the 200 SMA for now, but the gap between the moving averages has narrowed enough to hint at a likely bearish crossover. At the same time, the index is trading below both indicators, so these could hold as dynamic resistance levels from here.
Just don’t forget that the U.S. NFP report is still up for release later today and that rising speculations of a September Fed rate cut could still spark a risk rally before the close.
However you choose to trade this setup, make sure you’re following your trading plan and using your best risk management moves so you can trade for another day!