


I’m seeing a classic chart pattern forming on the 4-hour chart of EUR/GBP!
Are we about to see trend reversal soon?
Check out this near-term resistance I’m watching:
EUR/GBP: 4-hour
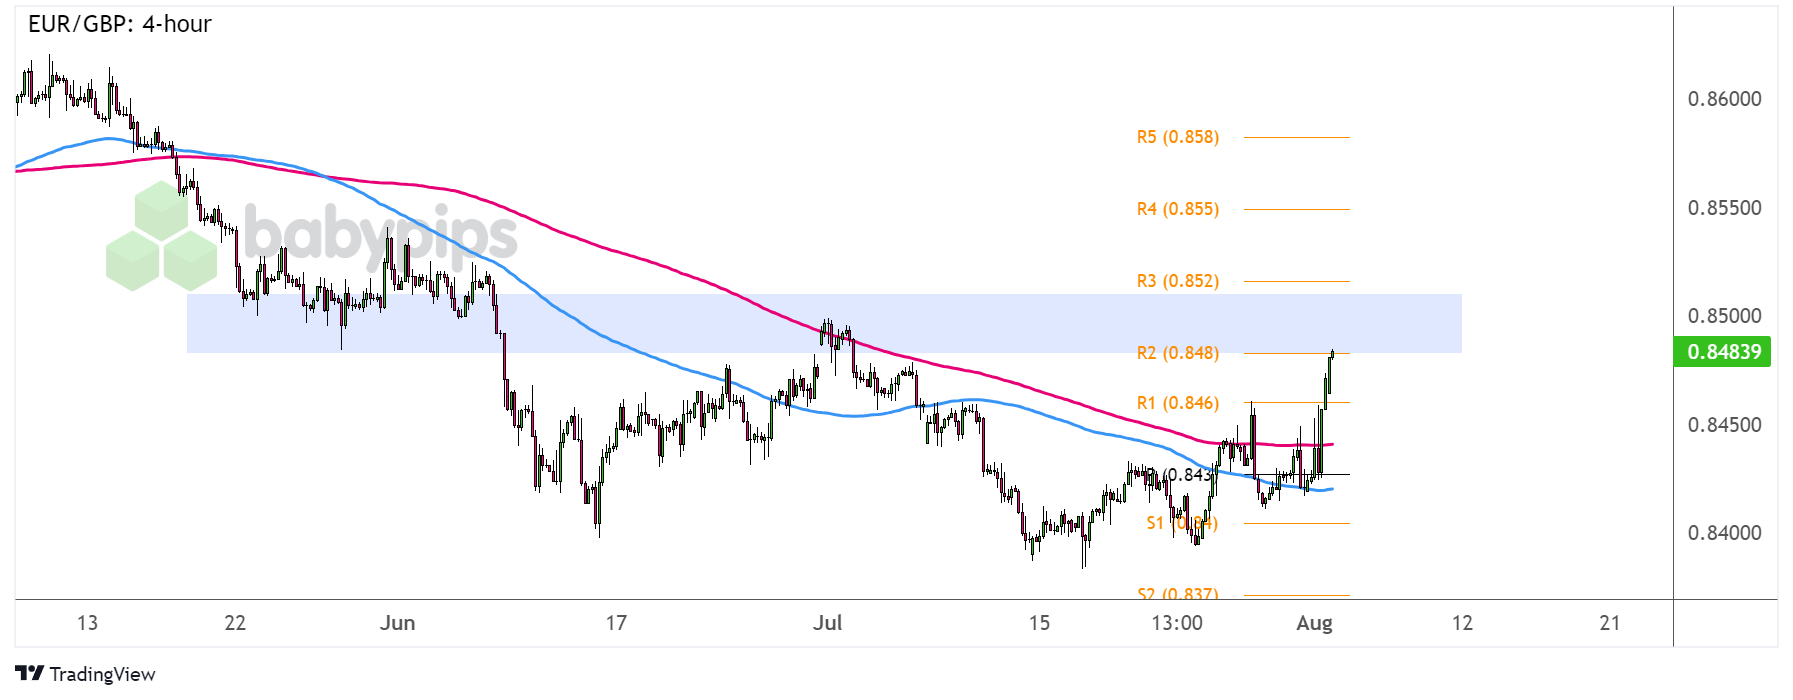
EUR/GBP 4-hour Forex Chart by TradingView
The Bank of England’s decision to cut interest rates spurred a sharp drop for sterling against the euro, as slowing underlying inflation convinced some MPC members to ease monetary policy.
This was enough to lift EUR/GBP above the .8450 minor psychological mark and take it closer to the .8500 major psychological mark, creating a double bottom pattern on its 4-hour time frame.
Will we see a neckline breakout and reversal from here?
Remember that directional biases and volatility conditions in market price are typically driven by fundamentals. If you haven’t yet done your fundie homework on the euro and the British pound, then it’s time to check out the economic calendar and stay updated on daily fundamental news!Sustained bearish pressure on sterling could take the pair past R2 (.8480) and onto a bullish break of the longer-term area of interest, potentially sparking a rally that could last by the same height as the formation or roughly 100 pips.
On the other hand, holding as resistance could send EUR/GBP back down to the near-term support zones at R1 (.8460) or all the way down to the lows near S1 (.8400).
The 100 SMA is below the 200 SMA to suggest that the path of least resistance is to the downside, but it’s also worth noting that price is above both moving averages as an early indication of a trend shift in favor of bulls.
However you choose to trade this setup, make sure you’re following your trading plan and using your best risk management moves so you can trade for another day!