


Cable is consolidating at a key support zone ahead of this week’s potential catalysts.
Will a bounce from the support zone help extend GBP/USD’s uptrend?
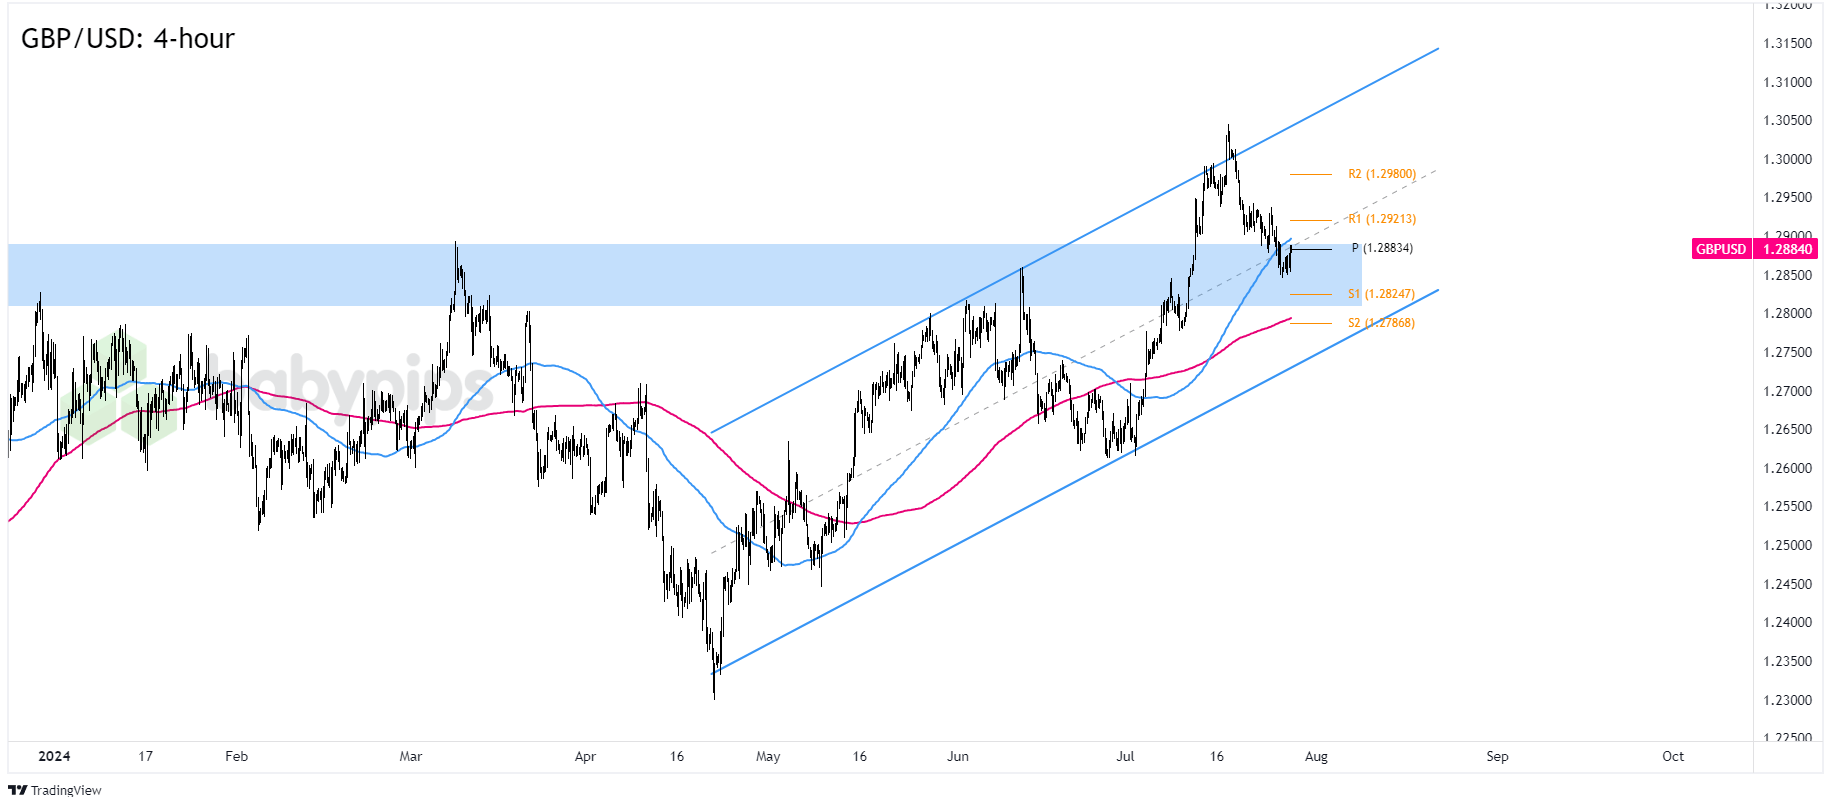
We’re zooming in on the 4-hour time frame for clues:
GBP/USD: 4-hour
GBP/USD 4-hour Forex Chart by TradingView
In case you missed it, easing political concerns in the U.K. has helped lift the British pound higher against its major counterparts.
On the other hand, mounting evidence for a potential rate cut in the U.S. is not doing the U.S. dollar favors against major currencies.
GBP/USD, which has been in an uptrend since May, hit fresh 2024 highs just under 1.3050 before easing back down to the 1.2875 area.
Remember that directional biases and volatility conditions in market price are typically driven by fundamentals. If you haven’t yet done your fundie homework on the U.S. dollar and the British pound, then it’s time to check out the economic calendar and stay updated on daily fundamental news!
Interestingly, GBP/USD’s current levels line up with the middle of an ascending channel pattern in the 4-hour time frame. Not only that, but it’s also not far from the Pivot Point line, the 100 SMA, AND some key resistance levels from earlier this year.
Is GBP/USD ready to extend its uptrend this week?
Look out for bullish candlesticks above the Pivot Point line. A bullish momentum above the support zone opens GBP/USD to a move to the R2 (1.2980) if not the 1.3000 psychological level or the 1.3050 previous highs.
An extension of the bearish swing in the second half of July is not off the table though.
If GBP/USD bounces lower from the Pivot Point line, or if it consistently trades below 1.2850, then Cable may head for the 1.2800 inflection point near the 200 SMA or retest the 1.2750 channel lows before seeing sustained bearish pressure.
What do you think? How low can GBP/USD go before the bulls show up again or is a bearish reversal in the cards?