


Missed the triangle breakout on gold?
I’m seeing a potential opportunity to hop in on a quick pullback!
Take a look at these support zones on the 4-hour chart.
Gold (XAU/USD): 4-hour
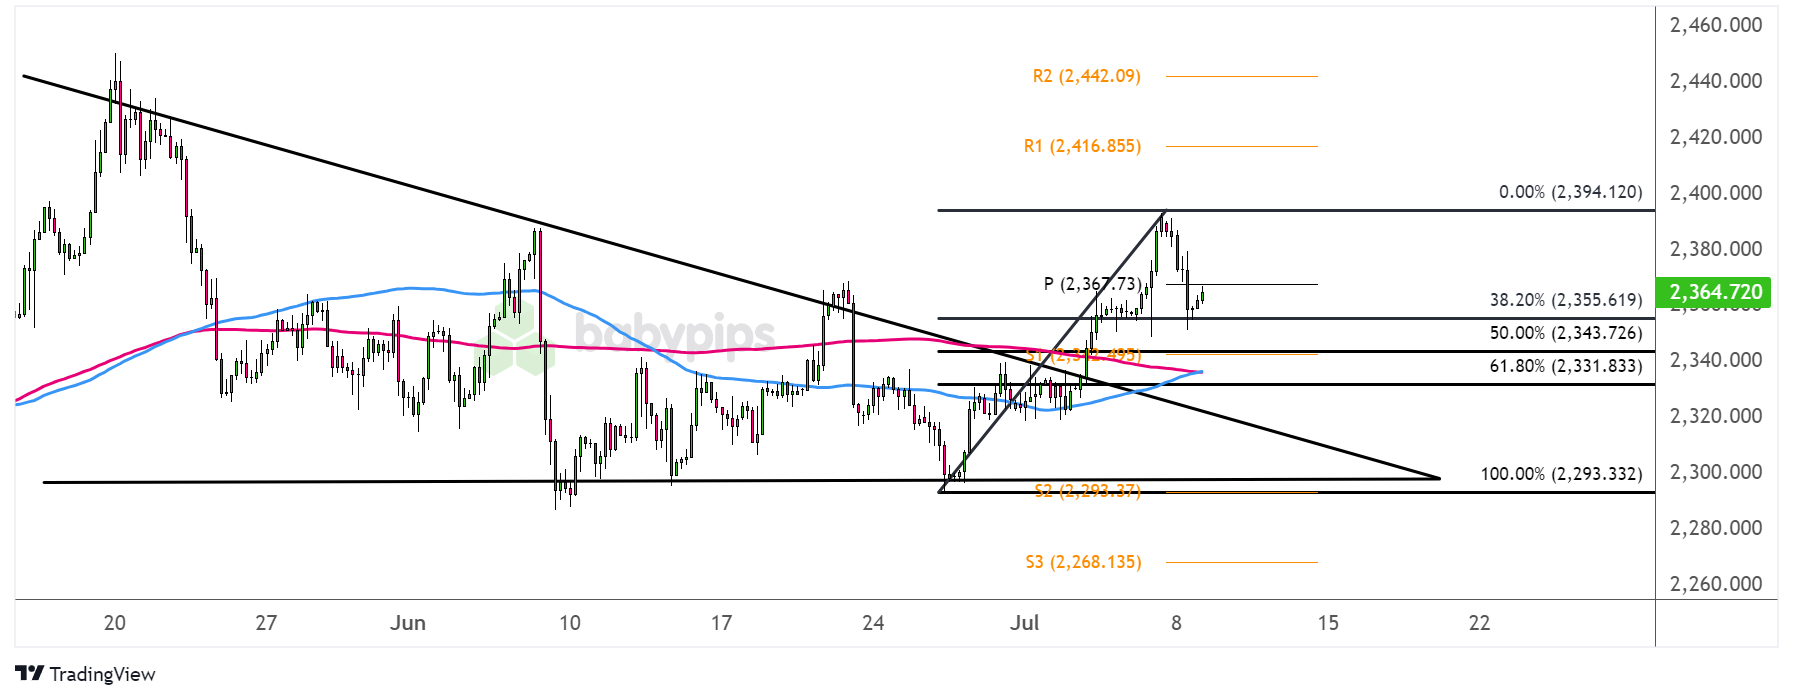
Gold (XAU/USD) 4-hour Chart by TradingView
Remember that descending triangle formation we spotted on gold a while back?
Well, the precious metal already busted through the resistance to suggest that a rally of the same height as the chart pattern is due.
However, bulls retreated upon getting wind of reports that the PBOC refrained from buying gold for another month in a row, taking XAU/USD down for a correction.
Can these Fibonacci retracement levels hold as support with this week’s U.S. catalysts?
Remember that directional biases and volatility conditions in market price are typically driven by fundamentals. If you haven’t yet done your fundie homework on gold and the U.S. dollar, then it’s time to check out the economic calendar and stay updated on daily fundamental news!Price is testing the 38.2% Fib, which seems to have attracted some buying interest, but a larger correction could still reach the 50% Fib near S1 ($2,342.49) or the 61.8% level that’s closer to the former triangle top.
If any of these hold as a floor, look out for a continuation of the climb back to the swing high around the $2,400 major psychological mark. A bullish moving average crossover appears to be looming, too!
Sustained upside momentum could even lift gold to fresh highs at R1 ($2,416.85) then R2 ($2,442.09) depending on what Fed head Powell has to say or how the U.S. CPI figures turn out.
Do you think gold prices can keep rising this week?