


Are oil prices in for a breakout soon?
Here’s a short-term consolidation pattern I’m watching on the hourly chart of WTI crude oil.
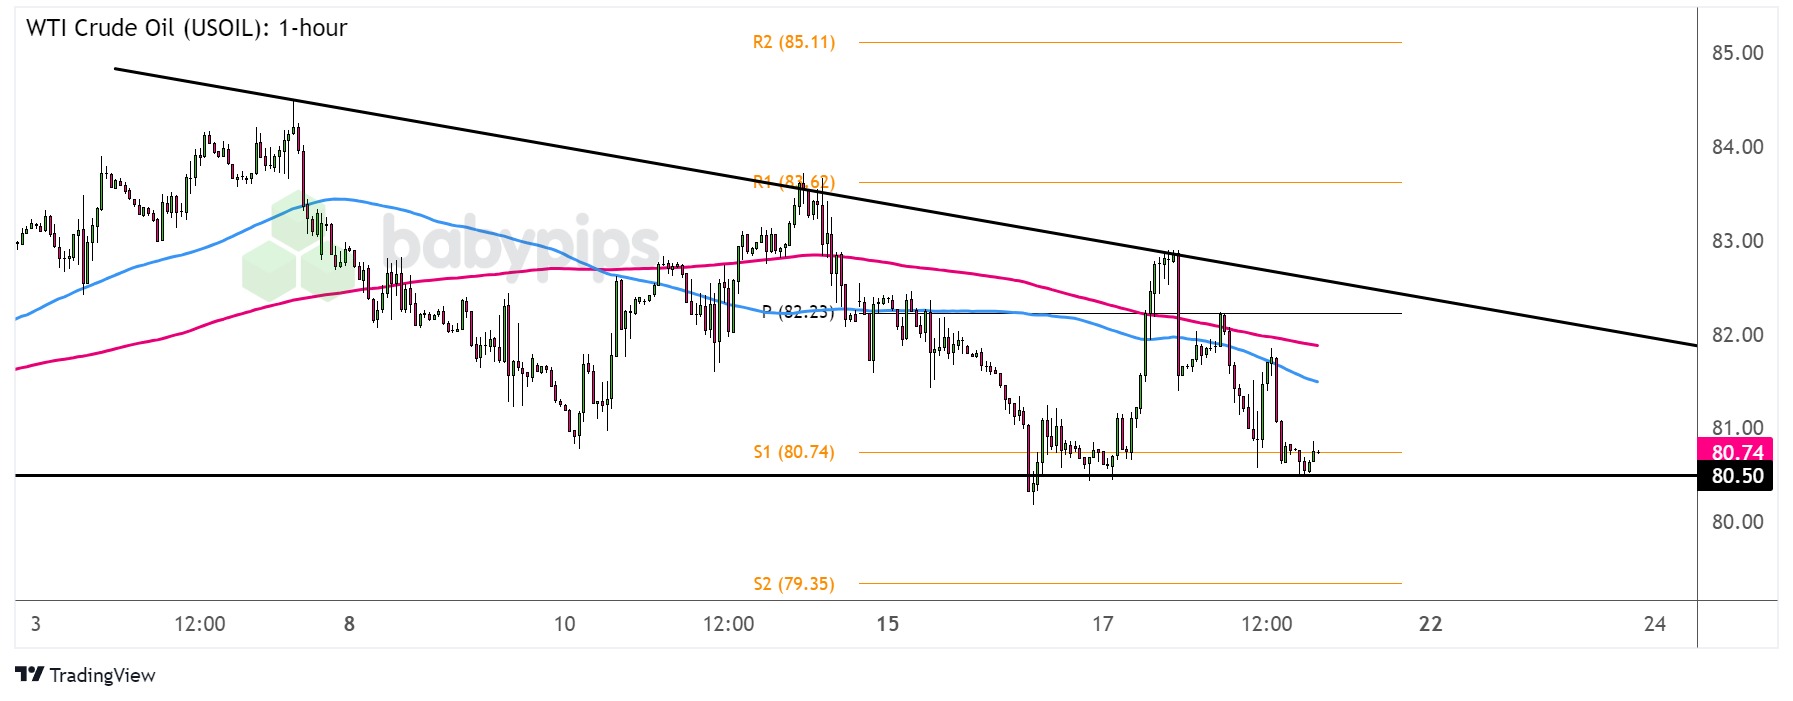
WTI Crude Oil (USOIL): 1-hour
WTI Crude Oil (USOIL) 4-hour Chart by TradingView
Downside price pressures have been in play for this energy commodity, as a weaker U.S. growth outlook is weighing on demand estimates.
Crude oil has formed lower highs and found support around $81.00 per barrel, creating a descending triangle pattern visible on its hourly chart.
Is this ongoing support test about to spur a bounce or a break?
Remember that directional biases and volatility conditions in market price are typically driven by fundamentals. If you haven’t yet done your fundie homework on crude oil and the U.S. dollar, then it’s time to check out the economic calendar and stay updated on daily fundamental news!Not even a larger than expected reduction in EIA inventories or rising speculations of a Fed easing move in September have been enough to trigger a sustained move higher for the commodity these days.
With that, a bearish break of the triangle support near S1 ($80.74 per barrel) could set off a drop that’s the same height as the formation or at least take it down to the next floor at S2 ($79.35 per barrel).
On the other hand, if crude oil bulls keep defending the floor, keep an eye out for a bounce back up to the resistance at the pivot point level ($82.23 per barrel). Just note that this lines up with the dynamic inflection points at the moving averages and that the 100 SMA is below the 200 SMA to reflect bearish vibes.
Do you think crude oil could stay in its holding pattern until the end of the week?