


USD/CAD is testing a key area of interest before the U.S. prints its June inflation reports.
Will the pair stay inside its current range?
Or is it ready for a breakout?
USD/CAD: 4-hour
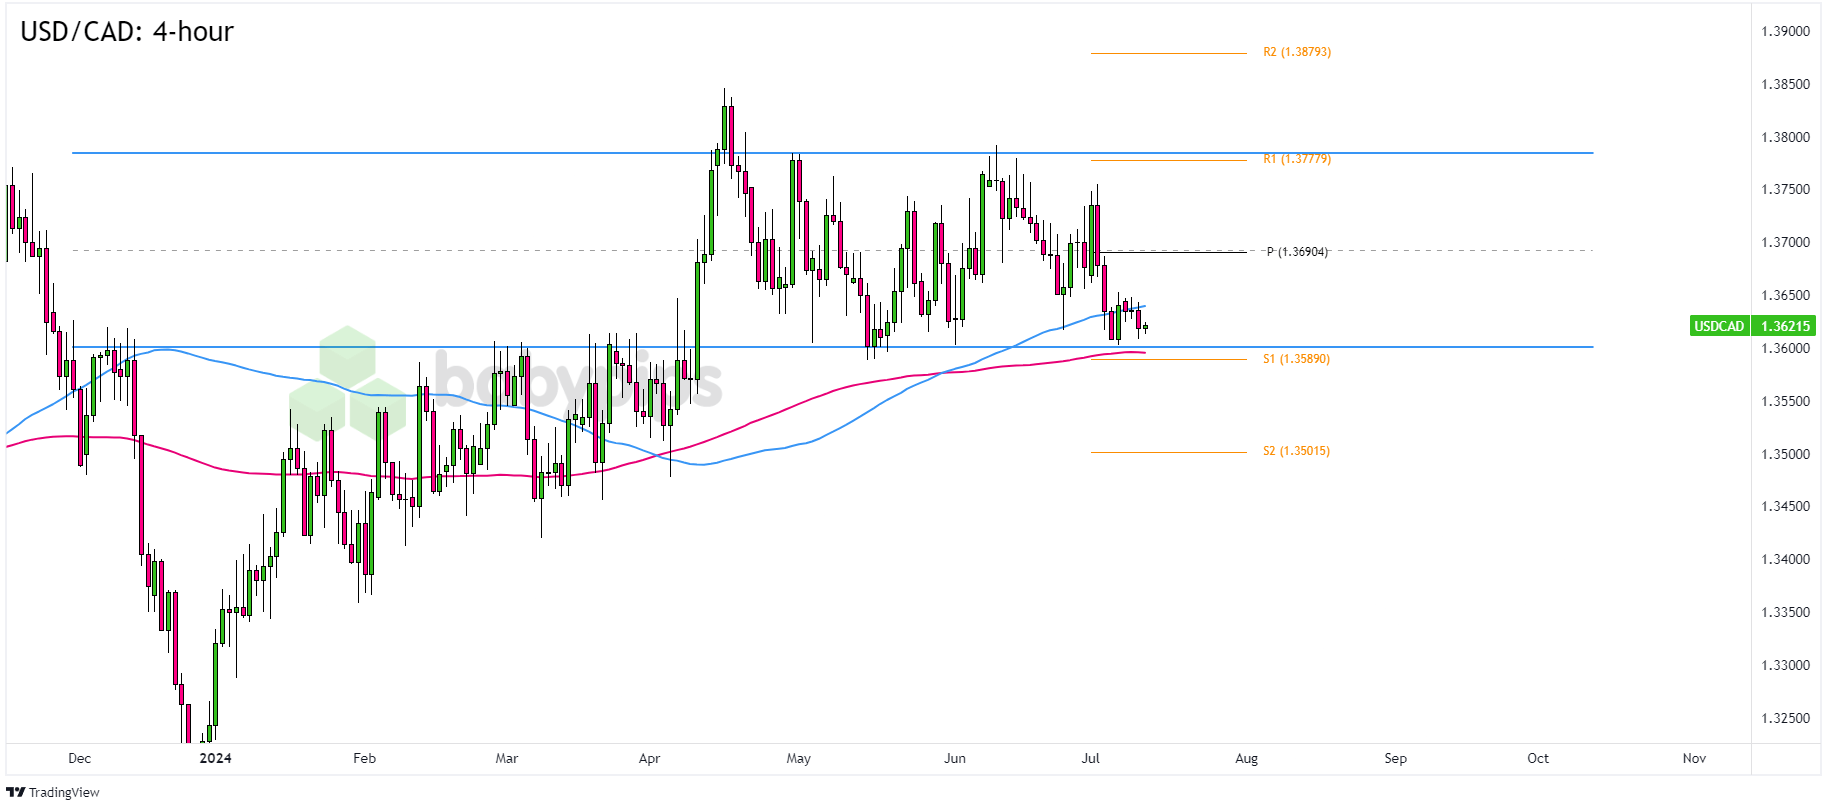
USD/CAD 4-hour Forex Chart by TradingView
The U.S. dollar has been losing pips to its Canadian counterpart for weeks now, thanks to improved risk sentiment, higher prices of crude oil – one of Canada’s largest exports – and increased Fed rate cut bets.
Remember that directional biases and volatility conditions in market price are typically driven by fundamentals. If you haven’t yet done your fundie homework on the U.S. and Canadian dollars, then it’s time to check out the economic calendar and stay updated on daily fundamental news!USD/CAD, which turned lower from the 1.3800 psychological handle in mid-June, is now trading closer to the 1.3600 area. As you can see, the pair’s current prices also line up with the S1 (1.3589) Pivot Point line as well as the 100 and 200 SMAs in the 4-hour time frame.
Will the pair remain inside its months-long range in the next few days?
The U.S. CPI report scheduled later today and Friday’s U.S. PPI and UoM consumer sentiment data can provide USD bulls and bears with enough catalyst to push USD/CAD in either direction.
Sticky high price pressures and resilient consumer confidence can push USD/CAD higher from the 1.3600 area of interest. Look out for bullish candlesticks above 1.3600 which could lead to a retest of the 1.3690 mid-range and Pivot Point line.
But if this week’s market themes encourage further dollar-selling, then USD/CAD may just break below its range.
Strong bearish candlesticks followed by sustained trading below the 1.3600 mark may lead to the pair retesting lower areas of interest like 1.3500 or 1.3450.
What do you think? Which way will USD/CAD go in the next few days?