


Earlier this week, U.S. crude oil prices turned lower from the $84.40 area for a second time this month.
Are oil prices headed lower? Or are the bulls just taking a breather?
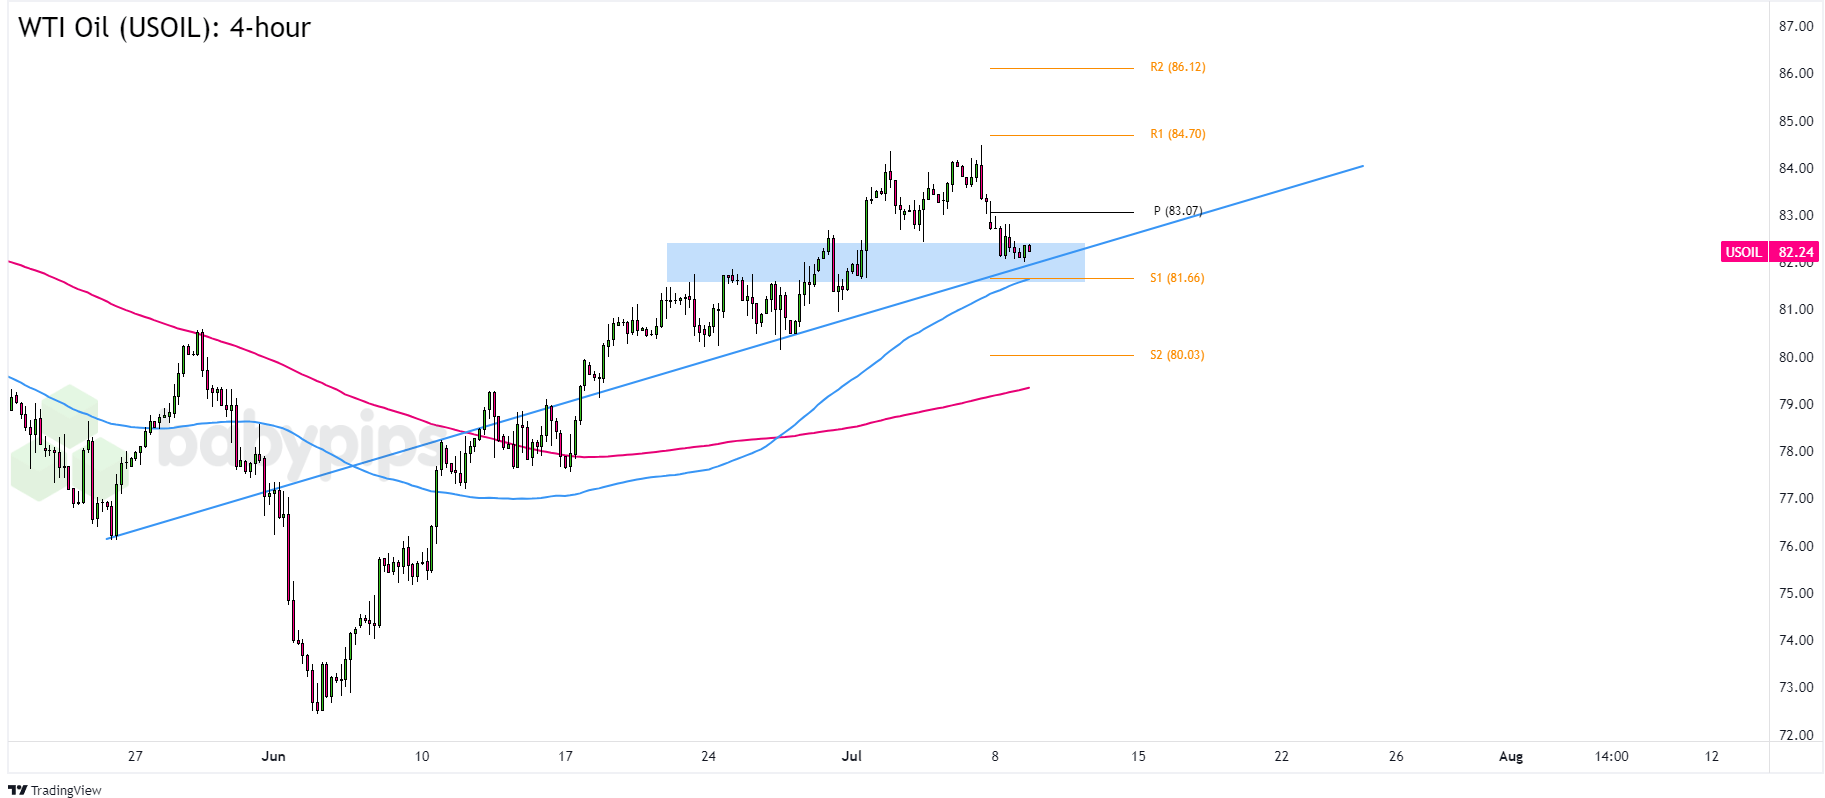
WTI Crude Oil (USOIL): 4-hour
WTI Crude Oil (USOIL) 4-hour Chart by TradingView
As mentioned in today’s Daily Broad Market Recap, commodities like crude oil took hits from overall U.S. dollar strength. The Black Crack, in particular, drew in bearish plays as concerns over the impact of Hurricane Beryl on Texas oil production eased.
Remember that directional biases and volatility conditions in market price are typically driven by fundamentals. If you haven’t yet done your fundie homework on crude oil and the U.S. dollar, then it’s time to check out the economic calendar and stay updated on daily fundamental news!WTI crude oil, which has been making higher highs and higher lows since late June, got rejected from the $84.40 area for a second time this month. It didn’t help that the resistance zone is near the R1 Pivot Point line.
Is the commodity done with its uptrend? Or are the bulls just taking a breather?
WTI is trading closer to $82.25, which is right around the S1 ($81.66) Pivot Point line, 100 SMA, and a previous area of interest.
A couple of decisive bullish candlesticks or sustained trading above $82.25 sets WTI prices for a potential retest of the previous $84.40 highs. And, if the fundamentals favor risk-taking or turn against the U.S. dollar in the next few days, we may see new monthly highs for the asset.
On the other hand, sustained trading below the 4-hour trend line or the S1 Pivot Point support opens the possibility of a bearish breakout.
WTI could draw in enough bearish demand to head for the S2 ($80.03) Pivot Point area if not the $79.50 levels near the 200 SMA.
What do you think? Will oil prices turn higher or lower from its current consolidation?