


USD/MXN has been falling since the end of June. ¡Ay caramba!
Recent price action favors the bears, but oversold signals hint at a possible pause or even a bounce so the bulls are whispering, “Esperen un momento, amigos!”
Welcome to TA of the Day (TAOTD)! 👋
Here’s the daily chart:
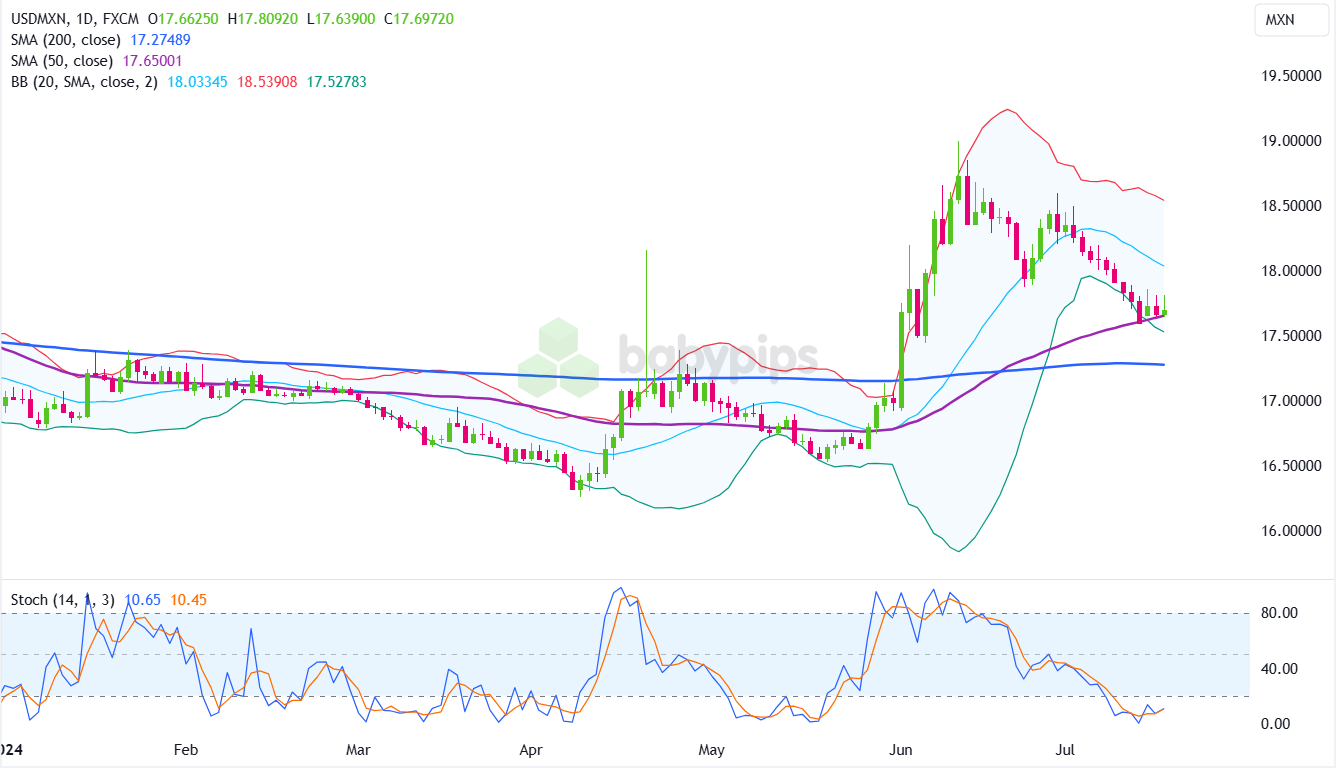
USD/MXN 1D Chart by TradingView
📈 Technical Analysis of USD/MXN Daily Chart
Using technical analysis concepts covered in our forex course, let’s analyze USD/MXN.
Moving Averages (SMA):
- 200-day SMA: Positioned around 17.2748. The price is currently above this level, indicating long-term bullish momentum. The slope is upward, indicating a long-term trend.
- 50-day SMA: Positioned around 17.6500. The price is slightly above this level, indicating a medium-term bullish trend. The slope is upward, and the 50 MA is above the 200 SMA, which are bullish signs.
If you’re new to moving averages read our School of Pipsology lessons on how to use moving averages.
Bollinger Bands (20, 2):
- Bollinger Bands: The price is currently near the lower Bollinger Band (17.5278), suggesting that the market might be oversold. This can often be a precursor to a price bounce back towards the middle or upper band.
If you’re new to Bollinger Bands, read our School of Pipsology lessons on how to use Bollinger Bands.
Stochastic:
- Stochastic: The current reading is around 10.65/10.45, indicating that the market is in the oversold territory. This suggests a potential for a reversal or at least a temporary bounce.
If you’re new to Stochastic, read our School of Pipsology lessons on how to use Stochastic.
🕵️ Key Observations
Price Action:
- Uptrend: The price has been in an uptrend, making higher highs and higher lows until the end of June, but recently experienced a pullback.
- Bearish Price Action: Observed in early July when the price started forming lower highs and lower lows after failing to sustain above 18.5000. A breakdown below the June 24 swing low is not a great sign for the bulls.
- Support: The price found support near the 50-day SMA (17.6500), which coincides with a previous area of consolidation.
- Resistance: The price is facing resistance near the recent high of around 18.5000.
Immediate Support and Resistance Levels:
- Support: Immediate support is around the 50-day SMA (17.6500) and the 200-day SMA (17.2748).
- Resistance: Immediate resistance is around the recent high at 18.00000 and further resistance at 18.5000.
If you’re new to support and resistance, read our School of Pipsology lessons on how to use support and resistance levels.
Bollinger Bands:
- The price being near the lower Bollinger Band suggests the market is oversold and a potential bounce back to the middle band (18.0334) or upper band (18.5390) is possible.
Stochastic Oscillator:
- Stochastic in the oversold region suggests that the selling pressure might be easing, and a bounce could be on the horizon.
🤔 Potential Trade Scenarios
The following trade scenarios are provided solely for educational purposes. Since they don’t include full risk management practices, they are not intended to serve as actual trade recommendations, but merely food for thought to help you generate your own trade idea.
Long Bias:
- Consideration Point: Consider entering a long position if the price finds support near the 50-day SMA (17.65001) and shows signs of a bounce, such as a bullish candlestick pattern or a Stochastic crossover from oversold levels.
- Invalidation Point: Consider setting a stop-loss below the 50-day SMA around 17.65001 to manage risk.
- Potential Target: Look for a move towards the middle Bollinger Band (18.03345) and the recent high at 18.00000. If the uptrend continues, target the upper Bollinger Band (18.53908).
Short Bias:
- Consideration Point: Consider entering a short position if the price fails to break above the resistance level at 18.0000 and shows signs of bearish momentum, such as a strong bearish candlestick pattern or the Stochastic failing to move out of the oversold territory.
- Invalidation Point: Consider setting a stop-loss above the recent high at 18.50000 to manage risk. This level is crucial as a break above it would invalidate the bearish setup.
- Potential Target: Initial target could be the 200-day SMA (17.2748). If bearish momentum continues, look for further downside towards 17.00000 or lower.
📝 TAOTD Summary
- Trend: The trend has been bullish, but the recent pullback and oversold Stochastic suggest a potential for a reversal or consolidation.
- Key Levels: Support at 17.6500 and 17.2748, resistance at 18.0000 and 18.5000.
- Momentum: Oversold conditions indicated by the Stochastic oscillator and the price near the lower Bollinger Band suggest a potential for a bounce, but if the price fails to hold support, further downside is possible.
- Moving Averages Analysis: With the the 50-day SMA above the 200-day SMA, and upward slopes on the 50-day and 200-day SMAs, the uptrend remains intact for now.