


The EUR/JPY currency pair, a star performer for bulls since the start of the year, now faces a major challenge. 😨
Teetering on the edge of an important dynamic support level, the question now is: Will the bulls continue their charge, or are we about to witness a shift in trend direction?
It faced this challenge five times this year and passed every time. Can it pass a sixth time?
Welcome to TA of the Day (TAOTD)! 👋
Here’s the daily chart:
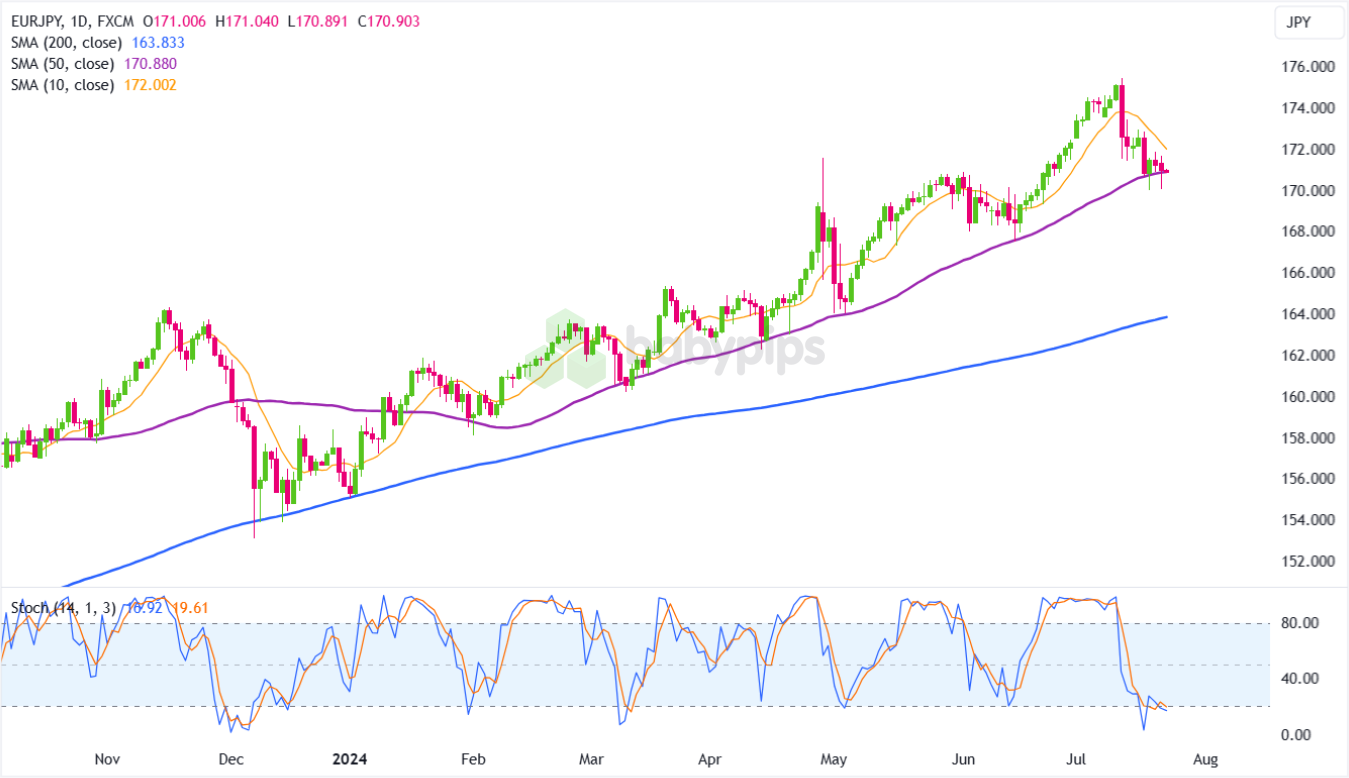
EUR/JPY 1D Chart by TradingView
📈 Technical Analysis of EUR/JPY Daily Chart
Using technical analysis concepts covered in our forex course, let’s analyze EUR/JPY.
Simple Moving Averages (SMA):
- 10-period SMA: Positioned around 172.00. The price is currently below this level, indicating short-term bearish momentum. The slope is downward, suggesting short-term weakness.
- 50-period SMA: Positioned around 170.88. The price is currently around this level, indicating a potential medium-term support or resistance area. The slope is upward, suggesting medium-term strength.
- 200-period SMA: Positioned around 163.83. The price is above this level, indicating long-term bullish momentum. The slope is upward, suggesting sustained long-term bullishness.
If you’re new to moving averages read our School of Pipsology lessons on how to use moving averages.
Relative Positioning of Moving Averages:
- The 10-period SMA is currently below the 50-period SMA, indicating recent short-term bearishness.
- The 50-period SMA is above the 200-period SMA, indicating that the medium-term trend is bullish.
- The 10-period SMA is above the 200-period SMA, reinforcing the overall long-term bullish trend despite recent short-term weakness.
Stochastic Oscillator:
- Stochastic Oscillator: The current reading is 6.92, indicating that the market is in the oversold territory. This suggests that the price might face support soon and could be due for a bounce.
If you’re new to Stochastic, read our School of Pipsology lessons on how to use Stochastic.
🕵️ Key Observations
Price Action:
- Uptrend: The price has been in an uptrend since late 2023, characterized by higher highs and higher lows.
- Correction: Recently, the price corrected from its peak of around 175.42 and is currently attempting to find support.
Support and Resistance Levels:
- Support: Immediate support is around 170.880 (50-period SMA) and 170.00, which aligns with recent lows.
- Resistance: Immediate resistance is around 172.00 (10-period SMA).
If you’re new to support and resistance, read our School of Pipsology lessons on how to use support and resistance levels.
Moving Averages:
- The 10-period SMA is currently acting as resistance, while the 50-period SMA is acting as potential support.
- ⚠️ 50-period SMA: Price tested this moving average five times this year and five times, it was able to hold as support.
Stochastic:
- The Stochastic Oscillator being in the oversold territory suggests a potential for a price bounce or consolidation.
Market Structure:
- Recent Swing Lows and Highs: The chart shows higher lows around 167.51 on June 13 and higher highs around 175.42 on July 11, followed by a recent low around 170.00.
- Break of Structure (BoS): A significant BoS occurred above the previous resistance at 170.00 in late June, indicating a continuation of the uptrend and reinforcing the bullish momentum.
- Change of Character (ChoCh): A ChoCh would be observed if the price breaks below the recent swing low at 167.51, indicating a potential shift in trend direction (from bullish to bearish).
🤔 Potential Trade Scenarios
The following trade scenarios are provided solely for educational purposes. Since they don’t include full risk management practices, they are not intended to serve as actual trade recommendations, but merely food for thought to help you generate your own trade idea.
Long Bias:
- Consideration Point: Consider entering a long position if the price finds support near 170.00 and shows signs of a bounce, such as a bullish candlestick pattern or a positive divergence in Stochastic. Additionally, a break above the resistance level at 172.00 could indicate a continuation of the uptrend.
- Invalidation Point: Consider setting a stop-loss below the support level around 169.000 to manage risk.
- Potential Target: Look for a move towards 174.00 and higher if the uptrend resumes.
Short Bias:
- Consideration Point: Consider entering a short position if the price fails to break above the resistance level at 172.002 and shows signs of bearish momentum, such as a strong bearish candlestick pattern.
- Invalidation Point: Consider setting a stop-loss above the recent high at 173.00 to manage risk. This level is crucial as a break above it would invalidate the bearish setup.
- Potential Target: Initial target could be the support level around 170.000. If bearish momentum continues, look for further downside towards 168.00 or lower.
📝 TAOTD Summary
- Trend: The long-term trend appears to be bullish with a series of higher highs and higher lows, but the short-term trend shows some weakness around the 10-period SMA.
- Key Levels: Support at 170.00 and resistance at 172.00.
- Momentum: The Stochastic Oscillator being in the oversold territory suggests a potential for a price bounce or consolidation.
- Market Structure: Recent BoS indicates a continuation of the bullish trend,
- Moving Averages Analysis: The downward slope on the 10-period SMA indicates short-term bearish momentum, while the upward slope on the 50-period and 200-period SMAs reinforces the medium-term and long-term bullish trends. The relative positioning of the moving averages shows that while there is long-term and medium-term bullishness, short-term resistance may need to be overcome for further gains.