


GBP/USD is just chillin’ around 1.2900, unable to make up its mind.
Sellers tried to take control, but they couldn’t quite get the job done, failing to close the day below 1.2900. Still, the bullish momentum is looking a bit meh.
Wall Street banks are betting that the British pound will extend its winning run, driven by a resilient economy and hopes for political stability.
The pound has been the best-performing major developed market currency this year, climbing 1.7% against the dollar to $1.29 and nearly 3% against the euro. 💪
Labour’s election victory has raised optimism among investors, and analysts forecast the pound will reach $1.35 by March next year.
Fundamentals sound great, but what about the technicals?
Welcome to TA of the Day (TAOTD)! 👋
Here’s the daily chart:
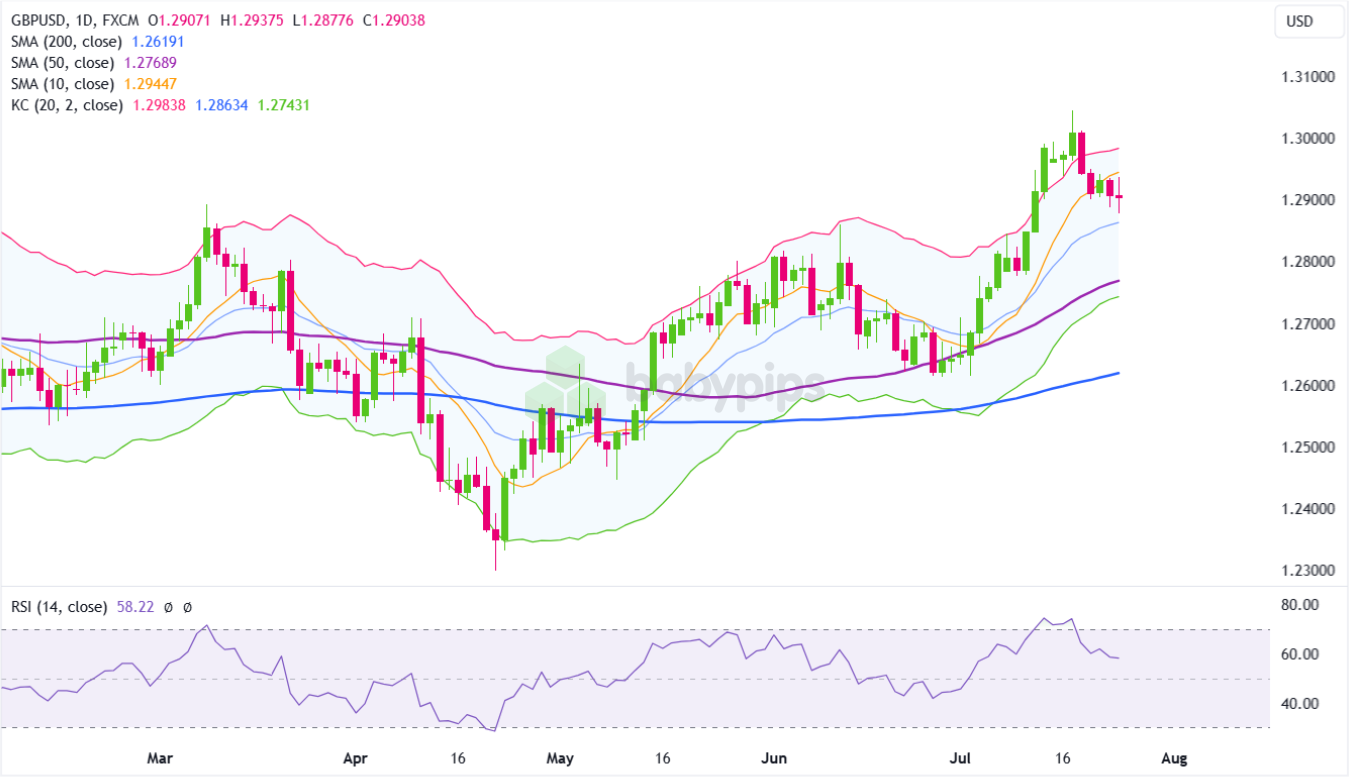
GBP/USD 1D Chart by TradingView
📈 Technical Analysis of GBP/USD Daily Chart
Using technical analysis concepts covered in our forex course, let’s analyze GBP/USD.
Simple Moving Averages (10, 50, 200):
- 10-period SMA: Positioned around 1.29444. The price is currently below this level, indicating the price is currently in a downturn. The slope is flattening, suggesting the price is no longer advancing with the same strength.
- 50-period SMA: Positioned around 1.27689. The price is above this level, indicating medium-term bullish momentum. The slope is upward, reinforcing medium-term strength.
- 200-period SMA: Positioned around 1.26191. The price is well above this level, indicating long-term bullish momentum. The slope is upward, suggesting sustained long-term bullishness.
If you’re new to moving averages read our School of Pipsology lessons on trading moving averages.
Relative Positioning of Moving Averages:
- The 10-period SMA is currently above the 50-period SMA, indicating that the price has been increasing more rapidly in the short term than in the medium term. This is considered a bullish signal, indicating that the trend is likely to continue upward in the short term.
- The 50-period SMA is above the 200-period SMA, indicating that the price has been increasing more rapidly in the medium term than in the long term. This is considered a bullish signal, indicating that the trend is likely to continue upward in the medium to long term.
- The price being above ALL these SMAs suggests strong bullish momentum across different time frames.
Keltner Channel (KC)
- Keltner Channel: The upper band is at 1.29838, the middle band is at 1.28634, and the lower band is at 1.27431. The price is currently near the middle band, suggesting that it is within the normal trading range.
If you’re new too Keltner Channels read our School of Pipsology lessons on how to use Keltner Channels.
RSI:
- RSI (14): The current reading is 58.22. This is in the neutral-to-bullish zone, suggesting that the market has a slight bullish bias but is not overbought.
If you’re new too RSI read our School of Pipsology lessons on how to use RSI.
🕵️ Key Observations
Price Action:
- Uptrend: The price has been in an uptrend since early June, characterized by higher highs and higher lows.
- Pullback: Recently, the price reached a high around 1.3044 before pulling back slightly. It’s currently trading around 1.29070, showing some consolidation after the recent upward move, and is currently attempting to find support.
Support and Resistance Levels:
- Support: Immediate support is around 1.28634 (middle Keltner band) and 1.27689 (50-period SMA).
- Resistance: Immediate resistance is around 1.29838 (upper Keltner band) and 1.3044 (recent high).
Moving Averages:
- The 10-period SMA is currently acting as immediate resistance, while the 50-period SMA provides a stronger medium-term support.
RSI:
- The RSI being in the neutral-to-bullish zone suggests a slight bullish bias, but there is room for both upward and downward movement.
Market Structure:
- Recent Swing Lows and Highs: The price has been making higher highs and higher lows after forming a swing low on April 19, confirming a bullish structure. The chart shows higher lows around 1.2700 in late June and higher highs above 1.3000 in mid-July, followed by a recent low around 1.2850.
- Break of Structure (BoS): A significant BoS occurred above the previous swing high at 1.2893 in early March, indicating a continuation of the uptrend and reinforcing the bullish momentum.
- Change of Character (ChoCh): A ChoCh would be observed if the price breaks below the recent higher swing low at 1.2299, indicating a market structure shift from bullish to bearish.
🤔 Potential Trade Scenarios
The following trade scenarios are provided solely for educational purposes. Since they don’t include full risk management practices, they are not intended to serve as actual trade recommendations, but merely food for thought to help you generate your own trade idea.
Long Bias:
- Consideration Point: Consider entering a long position if the price finds support near 1.28634 and shows signs of a bounce, such as a bullish candlestick pattern or a positive divergence in the RSI. Additionally, a break above the resistance level at 1.29838 and 1.3044 would indicate a continuation of the uptrend.
- Invalidation Point: Consider setting a stop-loss below the support level of around 1.27689 to manage risk.
- Potential Target: Look for a move towards 1.3100 and higher if the uptrend resumes.
Short Entry
- Consideration Point: Consider entering a short position if the price fails to break above the resistance level at 1.29838 and shows signs of bearish momentum, such as a strong bearish candlestick pattern or the RSI moving below 50.
- Invalidation Point: Consider setting a stop-loss above the recent high at 1.3000 to manage risk. This level is crucial as a break above it would invalidate the bearish setup.
- Potential Target: Initial target could be the support level around 1.28634. If bearish momentum continues, look for further downside towards 1.27689 or lower.
📝 TAOTD Summary
- Trend: The long-term trend appears to be bullish with a series of higher highs and higher lows, but the short-term trend shows some resistance around the 10-period SMA.
- Key Levels: Immediate support at 1.28634 and resistance at 1.29838.
- Momentum: The RSI indicates a slight bullish bias but suggests room for both upward and downward movement.
- Market Structure: Recent BoS indicates a continuation of the bullish trend, while monitoring for potential ChoCh is crucial for determining future price action. The next BoS would occur if the price breaks above the recent swing high of 1.3044, indicating further continuation of the uptrend.
- Moving Averages Analysis: The upward slopes on the 10-period, 50-period, and 200-period SMAs indicate strong bullish momentum across different time frames.