


Despite being considered a safe haven, gold was not immune to the shift in market sentiment to extreme risk-off as market participants dumped assets across the board.
Fueled by recession fears and an unwinding of global carry trades, gold fell over 1% today, dropping to $2,410 an ounce.
This sell-off had intensified due to growing concerns that the Federal Reserve’s monetary policy is not adequately supporting the slowing US economy. As a result, market participants are turning to bonds as a safer option.
Some analysts believe gold will bounce back and potentially reach new highs once market concerns ease.
Gold is expected to benefit from current geopolitical tensions and potential rate cuts by the Fed.
- Geopolitical tensions evoke fear and uncertainty, leading investors to seek the perceived safety and stability of gold.
- Rate cuts usually lead to a weaker US dollar, making gold more attractive as a store of value and hedge against currency devaluation.
Fundamentals support further gold appreciation, but what about the technicals?
Welcome to TA of the Day (TAOTD)! 👋
Let’s focus on the current technical setup of gold based on the 4-hour chart:
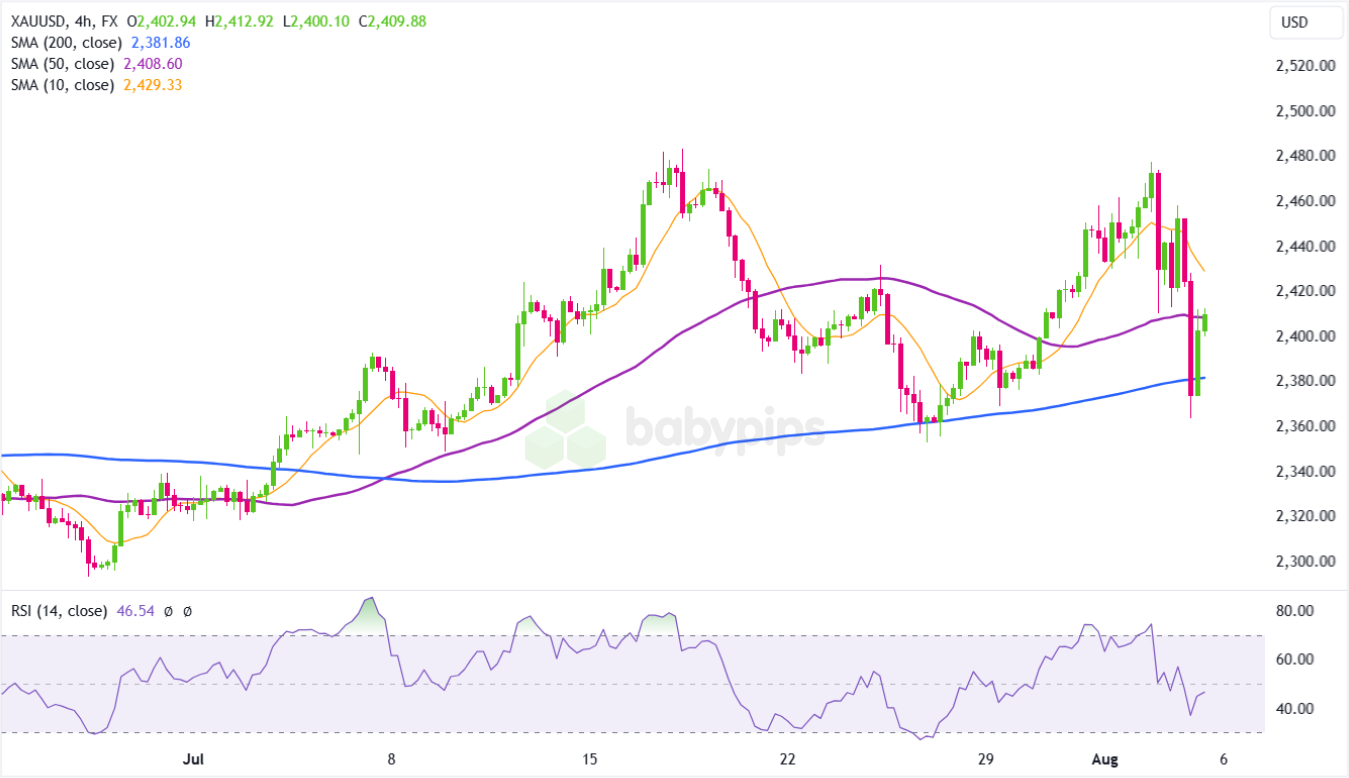
Gold 4H Chart by TradingView
📈 Technical Analysis of XAU/USD 4-hour Chart
Gold (XAUUSD) has been experiencing significant volatility in recent weeks, with prices showing both bullish and bearish movements.
Using technical analysis concepts covered in our forex course, let’s analyze gold (XAU/USD).
Simple Moving Averages (SMA):
- 10-period SMA (Orange): Positioned at 2,429. The price is currently below this level, indicating short-term bearish momentum. The downward slope suggests recent weakness.
- 50-period SMA (Purple): Positioned at 2,408. The price is fluctuating around this level, suggesting indecision in the medium term.
- 200-period SMA (Blue): Positioned at 2,381. The price is currently above this level, indicating long-term bullishness. The upward slope reinforces long-term strength.
Relative Positioning of Moving Averages:
- Order of Moving Averages: From top to bottom: 10 SMA (orange) > 50 SMA (purple) > 200 SMA (blue).
- Bearish Alignment: The 10 SMA being below the 50 SMA while the price is near both indicates a potential bearish trend in the short to medium term.
- Convergence: The moving averages are converging, which could indicate a potential trend change or consolidation period.
RSI (14):
- The current RSI reading is 46.54, indicating neutral momentum. This suggests that the market is neither overbought nor oversold, providing no immediate reversal signals.
🕵️ Key Observations
Price Action:
- Uptrend and Correction: The price was in an uptrend until late July, characterized by higher highs and higher lows. Recently, the price has faced a significant correction from its peak of around 2,480 and is currently consolidating around the 2,400 level.
- Recent Low: The recent low of around 2,360 is a key level to watch for potential support.
- Bullish Reversal Candle: The most recent candlestick shows a strong green candle, suggesting strong buying pressure and a potential short-term reversal.
Support and Resistance Levels:
- Support: Immediate support is around 2,381 (200-period SMA). Recently, the price bounced from this level, indicating potential short-term support.
- Resistance: Immediate resistance is around 2,429 (10-period SMA) and 2,409 (50-period SMA). Major resistance around 2,480 (double top).
Moving Averages:
- The 10-period and 50-period SMAs are currently acting as resistance levels, while the 200-period SMA provides critical support.
Market Structure:
- The overall structure remains bullish, but the recent sharp drop indicates increased volatility.
- A break above the recent high at 2,480 would confirm the continuation of the bullish trend.
🤔 Potential Trade Scenarios
The following trade scenarios are provided solely for educational purposes. Since they don’t include full risk management practices, they are not intended to serve as actual trade recommendations, but merely food for thought to help you generate your own trade idea.
Long Bias:
- Consideration Point: Consider entering a long position if the price finds support near 2,381 (200-period SMA) and shows signs of a bounce, such as a bullish candlestick pattern or positive divergence in the RSI. Additionally, a sustained breakout above the resistance level at 2,408.60 could indicate a potential recovery.
- Invalidation Point: Consider setting a stop-loss below the support level of around 2,360 to manage risk.
- Potential Target: Look for a move towards 2,450 and higher if the uptrend resumes.
- Rationale: Targeting 2,450 is based on the previous resistance level, which could act as a significant level for profit-taking. If the price manages to break above this level, it would indicate strong buying pressure and the possibility of further upside into a new all-time high (ATH).
Short Bias:
- Consideration Point: Consider entering a short position if the price fails to hold the support level at 2,381 and shows signs of bearish momentum, such as a strong bearish candlestick pattern or the RSI remaining below 40.
- Invalidation Point: Consider setting a stop-loss above the recent high at 2,429 to manage risk. This level is crucial as a break above it would invalidate the bearish setup.
- Potential Target: Initial target could be the support level of around 2,360. If bearish momentum continues, look for further downside towards 2,320 or lower.
- Rationale: Targeting 2,360 initially is due to it being a psychological and historical support level. If the price breaks below this level, it would signal further selling pressure and the potential for more significant downside towards the next support level at 2,320.
📝 TAOTD Summary
- Trend: The long-term trend appears bullish with the price above the 200-period SMA, but the short-term and medium-term trends show potential bearish momentum with prices below the 10-period and 50-period SMAs.
- Key Levels: Support at 2,381 and resistance at 2,429.
- Momentum: The RSI indicates neutral momentum, suggesting potential for a short-term bounce if it moves higher.
- Moving Averages Analysis: The downward slope on the 10-period and 50-period SMAs indicates strong bearish momentum in the short and medium terms. The 200-period SMA, with its upward slope, suggests critical long-term support.
While the recent V-shaped recovery suggests strong buying interest, the neutral RSI and recent volatility indicate caution.
This recent price action indicates a potential short-term bullish reversal. However, for this to be confirmed, the price would need to break and hold above immediate resistance levels, particularly the 10 SMA and the 50 SMA.
Watch for follow-through buying in the next few trading sessions to confirm if this is indeed a bullish reversal or a dead cat bounce.
Remember, this analysis is based solely on the technical aspects shown in the chart. In real trading scenarios, it’s crucial to consider fundamental factors, broader market conditions, and proper risk management techniques.
The gold market can be particularly sensitive to economic and geopolitical events, so these should also be taken into account.