


There was a massive drop in USD/JPY today after softer-than-expected CPI data was released in the U.S.
Will the USD/JPY bounce after such a sharp sell-off?
Welcome to TA of the Day (TAOTD)!
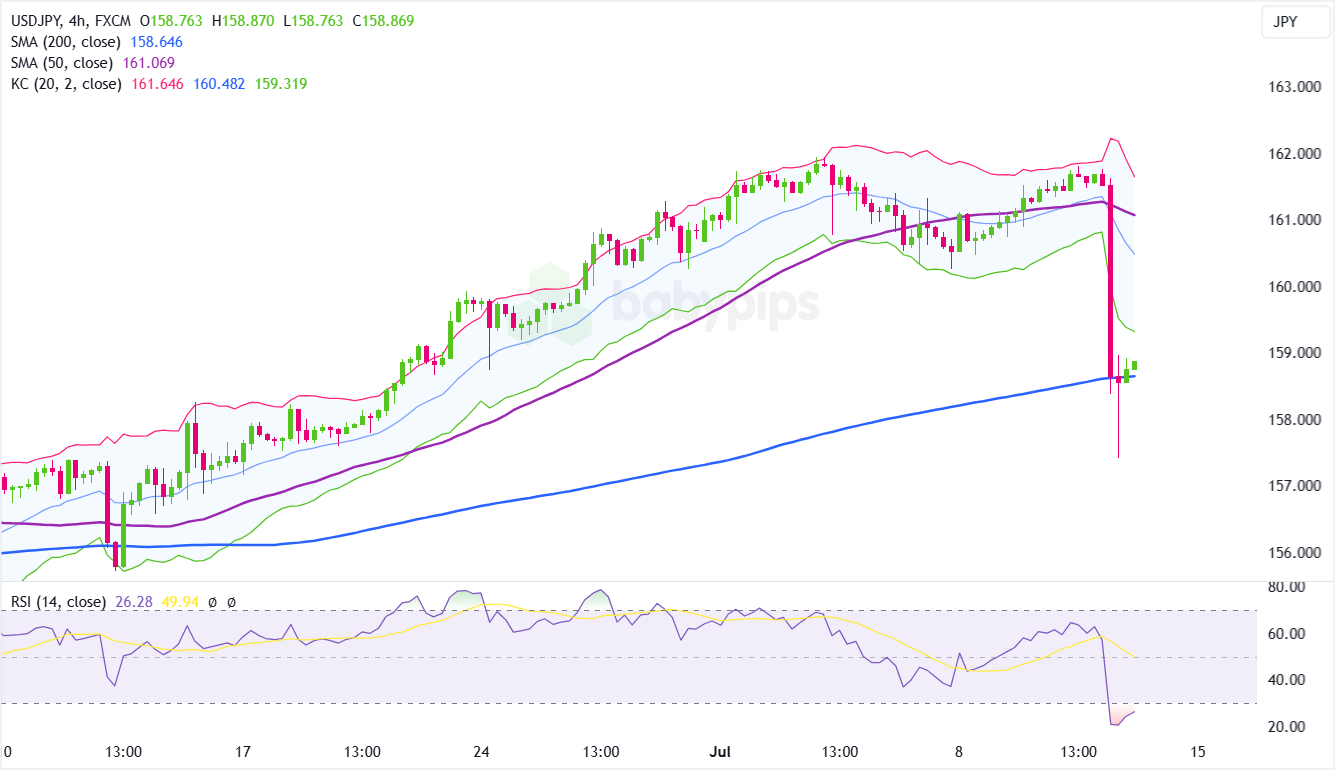
Here’s the 4-hour chart:
USD/JPY 1-Hour Chart by TradingView
Using technical analysis concepts covered in our forex course, let’s analyze USD/JPY.
Technical Analysis of USD/JPY 4-Hour Chart
Simple Moving Averages (SMAs)
- 200 SMA: Positioned around 158.63. The price is currently near this level, indicating it as a significant support. The slope of the 200 SMA is upward, suggesting long-term bullish momentum.
- 50 SMA: Positioned around 161.12. The price is below this level, indicating a potential bearish sentiment in the short term.
If you’re new to SMAs, read our School of Pipsology lessons on simple moving averages.
Keltner Channel
- Keltner Channel: The price has moved below the middle line of the Keltner Channel (160.66), and the lower band (159.39)indicating potential bearish momentum.
If you’re not familar with Keltner Chaneels read our School of Pipsology lessons on Keltner Channels.
Relative Strength Index
- RSI (14): The current reading is around 25.77, indicating that the market is in the oversold territory. This suggests a potential for a reversal or at least a temporary bounce.
If you’re new to RSI, read our School of Pipsology lessons on Relative Strength Index (RSI).
Key Observations
Price Action:
- Recent Trend: The price had been in an uptrend but recently experienced a sharp sell-off, breaking below both the 50 SMA and the middle line of the Keltner Channel.
- Support: The price found support near the 200 SMA (158.63).
- Resistance: Before plunging, the price faced resistance near the upper Channel line (161.85).
Support and Resistance Levels:
- Support: Immediate support at the 200 SMA (158.63).
- Resistance: Likely around the 50 SMA (161.12) and the middle Keltner Channel line (160.66).
If you’re new to the conccept of “support and resistance,” read our School of Pipsology lessons on trading support and resistance levels.
RSI Indicator:
- The RSI in the oversold region suggests that the selling pressure might be easing, and a reversal could be on the horizon.
Potential Trade Scenarios
The following trade scenarios are provided solely for educational purposes. Since they don’t include full risk management practices, they are not intended to serve as actual trade recommendations, but merely food for thought to help you generate your own trade idea.
Long Bias:
- Consideration Point: Consider entering a long position if the price shows signs of support near the 200 SMA (158.63) or the lower Keltner Channel band (159.39) with confirmation from a bullish candlestick pattern or a rebound in the RSI from oversold levels.
- Invalidation Point: Consider a stop-loss below the 200 SMA around 158.63. Or even below the most recent spike low around 157.44.
- Potential Target: Look for a move towards the 50 SMA (161.12) and the middle Keltner Channel line (160.66) if the reversal gains momentum.
Short Bias
- Consideration Point: Consider entering a short position if the price fails to hold above the 200 SMA (158.63) and shows signs of continued bearish momentum, such as a strong bearish candlestick pattern or a failure of the RSI to move out of the oversold territory.
- Invalidation Point: Consider a stop-loss above the recent high at 161.124 to manage risk. This level is crucial as a breakout above it would invalidate the bearish setup.
- Potential Target: Initial target could be the swing lowi in late June (154.55). If bearish momentum continues, look for further downside towards 150.00.
TAOTD Summary
- Trend: The trend had been bullish, but the recent sharp sell-off and the price moving below the 50 SMA and middle Keltner Channel line suggest a potential shift to bearish sentiment.
- Key Levels: Support at 158.63 (200 SMA), resistance at 161.12 and 160.66.
- Momentum: Oversold conditions indicated by the RSI suggest a potential for a bounce, but if the price fails to hold support, further downside is possible.