


Copper prices has been plummeting, falling to a near four-month low due to concerns over slowing Chinese demand and increased production.
China is the biggest user of copper in the world, using it a lot in construction, manufacturing, electronics, and the power sector.
Because of this, how much copper China needs has a big impact on copper prices everywhere
It seems like China’s copper market is showing signs of improvement after a significant slump in demand.
Buyers are cautiously returning as prices have fallen from a record high.
Important signs that things might be getting better are higher import fees and lower stock levels.
Also, the power sector is spending more money, which is expected to lead to higher copper consumption since they will need more copper for their projects.
Sounds like copper fundamentals provide a bullish case, but what about the technicals?
Welcome to TA of the Day (TAOTD)! 👋
Here’s the daily chart:
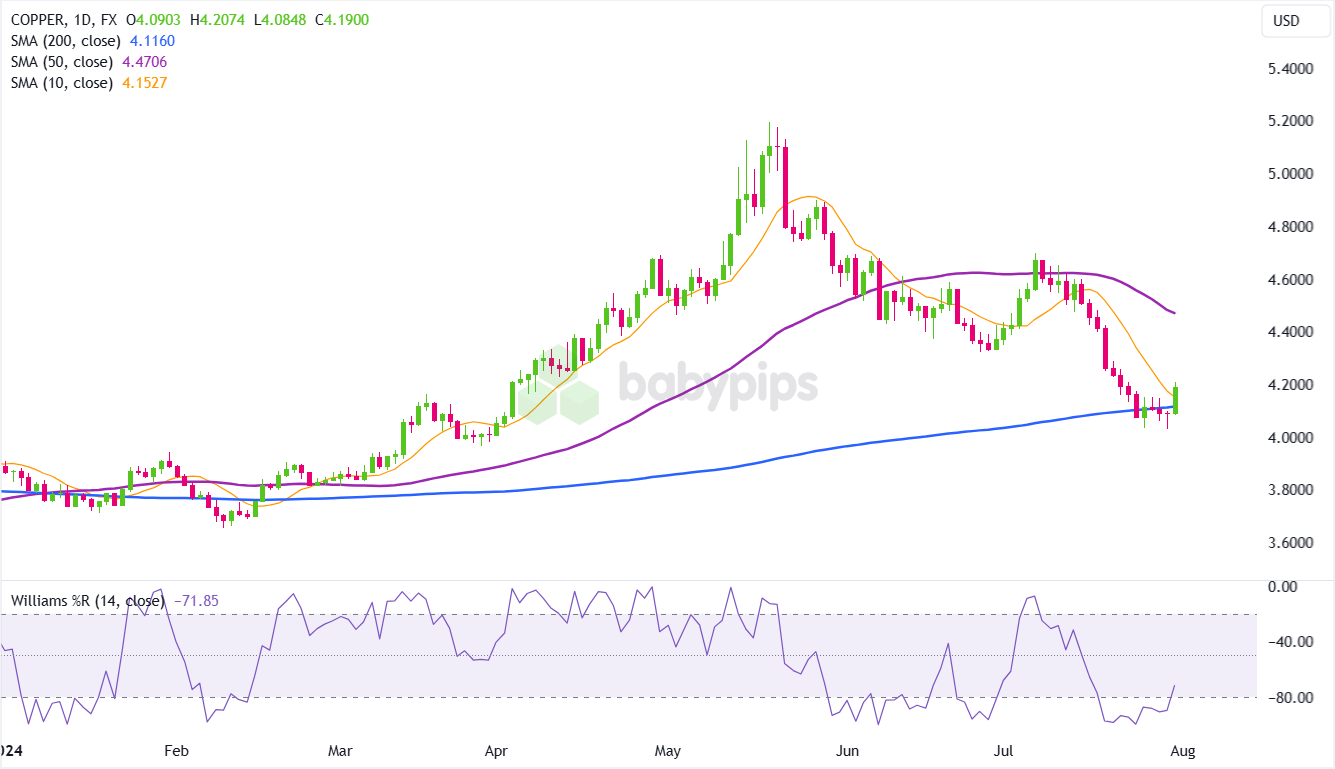
COPPER 1D Chart by TradingView
📈 Technical Analysis of COPPER Daily Chart
Using technical analysis concepts covered in our forex course, let’s analyze COPPER.
Simple Moving Averages:
- 10-period SMA: Positioned around 4.152. The price is currently below this level, indicating short-term bearish momentum. The slope is downward, suggesting recent short-term weakness.
- 50-period SMA: Positioned around 4.470. The price is below this level, indicating medium-term bearish momentum. The slope is downward, reinforcing medium-term weakness.
- 200-period SMA: Positioned around 4.116. The price is currently around this level, indicating a potential support zone. The slope is upward, suggesting long-term bullishness despite recent price declines.
Relative Positioning of Moving Averages:
- Order of Moving Averages: From top to bottom: 50 SMA (purple) > 10 SMA (orange) > 200 SMA (blue)
- Bearish Alignment: The 50 SMA being above the 200 SMA while the price is below both indicates a bearish trend. This is often referred to as a “death cross” configuration.
- Short-term vs Long-term: The 10 SMA is below the 50 SMA but above the 200 SMA, suggesting short-term weakness but potential long-term support.
- Convergence: The moving averages are converging, which could indicate a potential trend change or consolidation period approaching.
- Crossovers: The 10 SMA has recently crossed above the 200 SMA, which is a mildly bullish signal. However, a more significant bullish signal would be if the 10 SMA crosses above the 50 SMA.
If you’re new to moving averages read our School of Pipsology lessons on how to use moving averages.
Williams %R (14)
- Williams %R: The current reading is -71.85, indicating that the market is in the oversold territory. This suggests that the price might face support soon and could be due for a bounce.
If you’re new to Williams %R read our School of Pipsology lessons on how to use Williams %R.
🕵️ Key Observations
Price Action:
- Downtrend: The price has been in a downtrend since mid-June, characterized by lower highs and lower lows. The recent low around 4.000 is a key level to watch.
- Sharp Decline: There was a significant drop in price from early July to now, with several long red candles indicating strong selling pressure.
- Bottoming Attempt: The price appears to have found some support around the 4.08-4.10 level, which coincides closely with the 200 SMA.
- Bullish Reversal Candle: The most recent candlestick is a strong green (bullish) candle, suggesting strong buying pressure and a potential short-term reversal or at least a pause in the downtrend.
- Stabilization: Price is showing signs of stabilization around the 4.20 level
Support and Resistance Levels:
- Support: Immediate support is around 4.116 (200-period SMA). Recently, the price bounced from the 200-period SMA, indicating potential short-term support.
- Resistance: Immediate resistance is around 4.152 (10-period SMA) and 4.470 (50-period SMA).
If you’re new to the concept of “support and resistance” read our School of Pipsology lessons on how to use support and resistance.
Moving Averages:
- Price in Relation to MAs: The price is currently between the 10 SMA and 200 SMA, having recently crossed above the 200 SMA. This could signal a potential bullish shift in the short term.
- MA Compression: The space between the moving averages has been narrowing, which often precedes a significant price move (direction uncertain).
Williams %R:
- The Williams %R turning up from oversold levels suggests a potential for a price bounce.
Market Structure:
- Recent Swing Lows and Highs: The chart shows lower lows around 4.00 and lower highs around 4.60.
- Break of Structure (BoS): A significant BoS occurred below the previous support at 4.32 , indicating a continuation of the downtrend.
- Change of Character (ChoCh): A ChoCh would be observed if the price breaks above the recent lower high at 4.69, indicating a potential shift in market structure from bearish to bullish.
🤔 Potential Trade Scenarios
The following trade scenarios are provided solely for educational purposes. Since they don’t include full risk management practices, they are not intended to serve as actual trade recommendations, but merely food for thought to help you generate your own trade idea.
Long Bias:
- Entry Point: Consider entering a long position if the price finds support near 4.116 and shows signs of a bounce, such as a bullish candlestick pattern or a positive divergence in the Williams %R. Additionally, a breakout above the resistance level at 4.152 could indicate a potential recovery.
- Stop-Loss: Consider setting a stop-loss below the support level around 4.000 to manage risk.
- Target: Look for a move towards 4.400 and higher if the uptrend resumes.
- Rationale: Targeting 4.400 is based on the previous resistance level, which could act as a significant level for profit-taking. If the price manages to break above this level, it would indicate strong buying pressure and the possibility of further upside.
Short Bias:
- Entry Point: Consider entering a short position if the price fails to hold the support level at 4.116 and shows signs of bearish momentum, such as a strong bearish candlestick pattern or the Williams %R remaining in oversold territory.
- Stop-Loss: Consider setting a stop-loss above the recent high at 4.200 to manage risk. This level is crucial as a break above it would invalidate the bearish setup.
- Target: Initial target could be the support level around 4.0000. If bearish momentum continues, look for further downside towards 3.800 or lower.
- Rationale: Targeting 4.000 initially is due to it being a psychological and historical support level. If the price breaks below this level, it would signal further selling pressure and the potential for more significant downside towards the next support level at 3.800.
📝 TAOTD Summary
- Trend: The long-term trend appears to be bullish with the price around the 200-period SMA, but the short-term and medium-term trends show significant bearish momentum with prices below the 10-period and 50-period SMAs.
- Key Levels: Support at 4.11 and resistance at 4.152.
- Momentum: The Williams %R indicates an oversold condition, suggesting potential for a short-term bounc.
- Market Structure: Recent BoS indicates a continuation of the bearish trend. The next ChoCh could occur if the price breaks above the recent lower high at 4.690, indicating a potential shift in market structure from bearish to bullish.
- Moving Averages Analysis: The downward slopes on the 10-period and 50-period SMAs indicate strong bearish momentum in the short and medium terms. The 200-period SMA, with its upward slope, suggests critical long-term support.
This recent price action indicates a potential short-term bullish reversal or at least a pause in the downtrend. However, for this to be confirmed, the price would need to break and hold above immediate resistance levels, particularly the 10 SMA and the 50 SMA.
Watch for follow-through buying in the next few trading sessions to confirm if this is indeed a reversal or merely a short-term bounce within the larger downtrend.