


Missed the breakout on WTI crude oil’s triangle pattern?
Better keep tabs on these Fibonacci retracement levels in case price makes a retest!
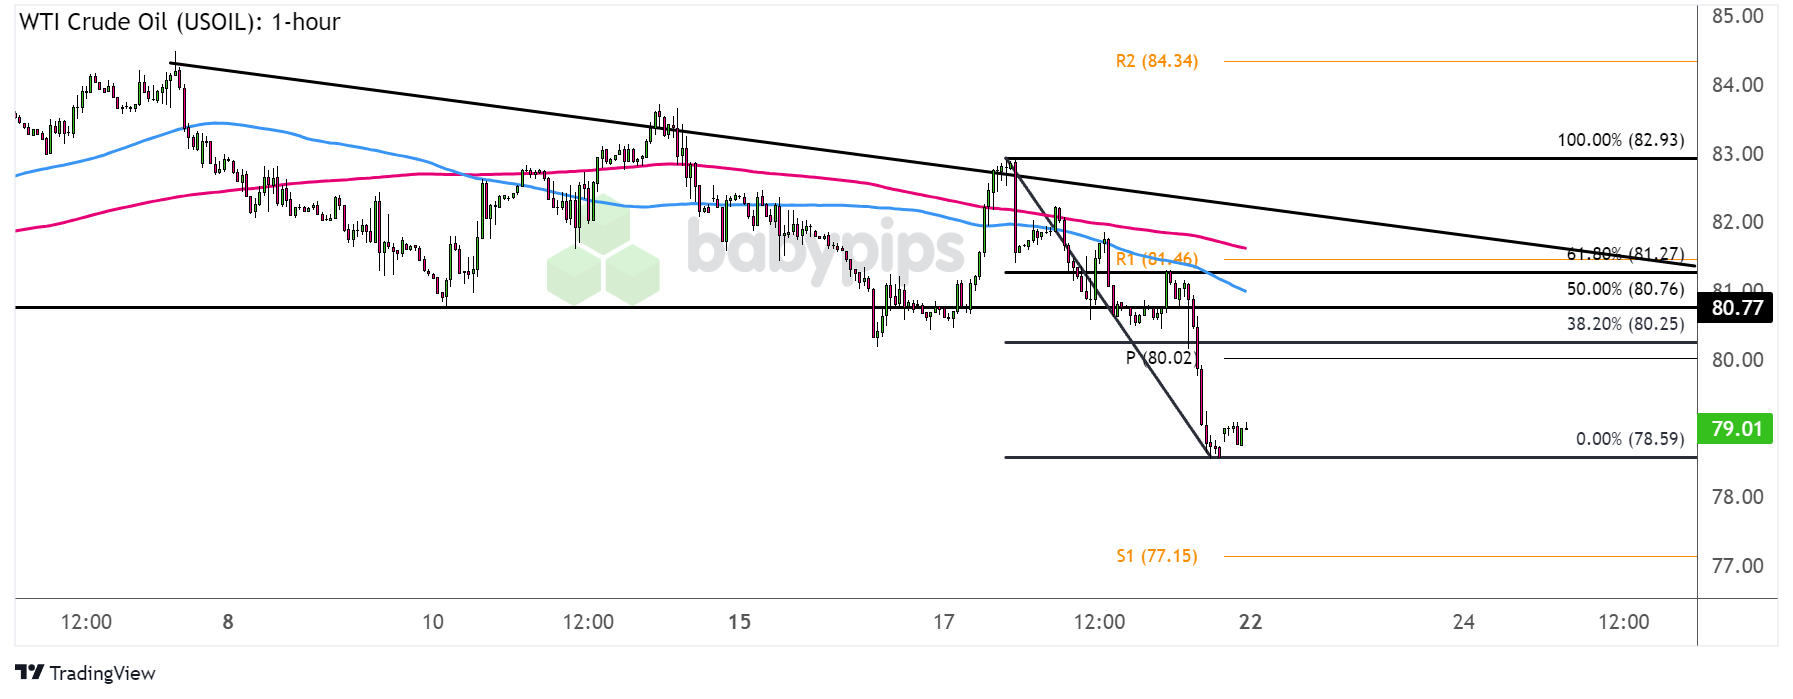
WTI Crude Oil (USOIL): 1-hour
WTI Crude Oil (USOIL) 4-hour Chart by TradingView
Looks like crude oil picked the bearish route on that triangle consolidation pattern we were watching last week!
Is the commodity in for further losses from here?
Remember that directional biases and volatility conditions in market price are typically driven by fundamentals. If you haven’t yet done your fundie homework on crude oil and the U.S. dollar, then it’s time to check out the economic calendar and stay updated on daily fundamental news!Price stalled around the $78.60 per barrel mark and gapped higher over the weekend, suggesting that some bullish pressure may be in play. This could be enough to spur a pullback to the former triangle support area, which is near the pivot point level ($80.02 per barrel) and a major psychological mark.
This area of interest also happens to coincide with the 50% Fibonacci retracement level, so the confluence could attract crude oil bears and allow the selloff to resume.
A larger correction could reach the 61.8% Fib near R1 ($81.46 per barrel) and the 200 SMA while a shallow pullback could already hit a ceiling at the 38.2% Fib, so watch out for reversal candlesticks at those regions.
If any of the Fibs hold as resistance, crude oil could set its sights back on the swing low or all the way down to S1 ($77.15 per barrel) since the 100 SMA is below the 200 SMA to confirm the presence of bearish vibes.
How low do you think crude oil prices can go from here?