


Crude oil has been on a tear these days, but could it sustain its rallies past this longer-term area of interest?
Check out these inflection points I’m watching on the 4-hour time frame.
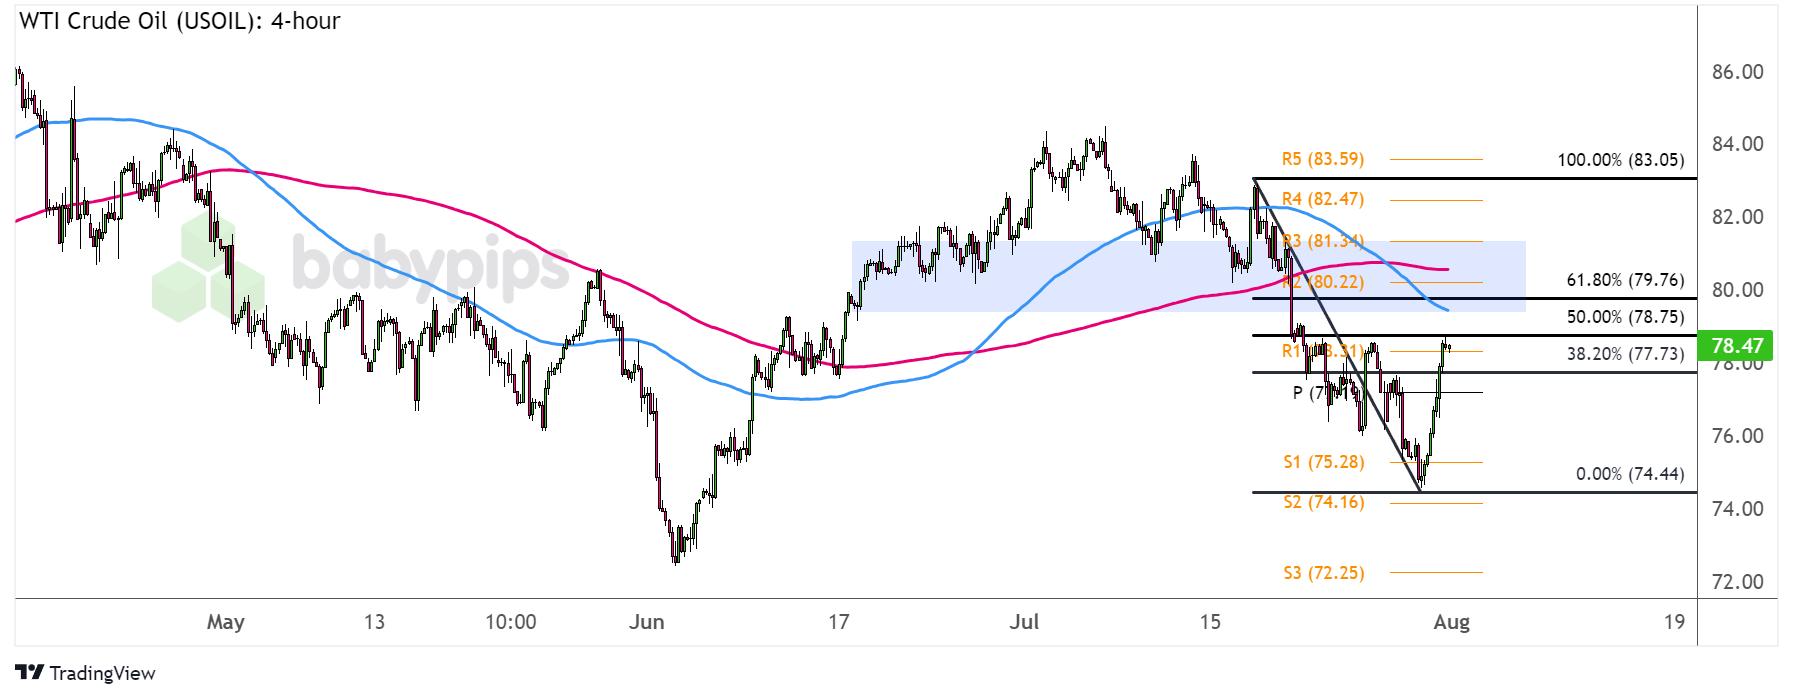
WTI Crude Oil (USOIL): 4-hour
WTI Crude Oil (USOIL) Chart by TradingView
Geopolitical tensions are back in the market mix these days, propping the energy commodity higher once more on supply concerns.
As it turned out, ceasefire negotiations are starting to break down as Israel claimed to have killed Hezbollah’s top commander in a Beirut operation earlier this week.
This, along with a surge in risk appetite stemming from a dovish FOMC statement, took crude oil close to its 50% Fibonacci retracement on the 4-hour chart.
Remember that directional biases and volatility conditions in market price are typically driven by fundamentals. If you haven’t yet done your fundie homework on market sentiment and crude oil, then it’s time to check out the economic calendar and stay updated on daily fundamental news!A larger correction could take crude oil up to the 61.8% level close to the $80 per barrel major psychological mark, which has held as resistance in May and support for the most part of June and July.
Oh, and did I mention that it’s right around R2 ($80.22 per barrel) and the dynamic inflection points at the moving averages, too?
The 100 SMA just recently crossed below the 200 SMA to suggest that the path of least resistance is to the downside or that the selloff is likely to resume, potentially taking WTI crude oil down to the swing low near S2 ($74.16 per barrel) or down to the June lows near S3 ($72.25 per barrel).
However you choose to trade this setup, make sure you’re following your trading plan and using your best risk management moves so you can trade for another day!